
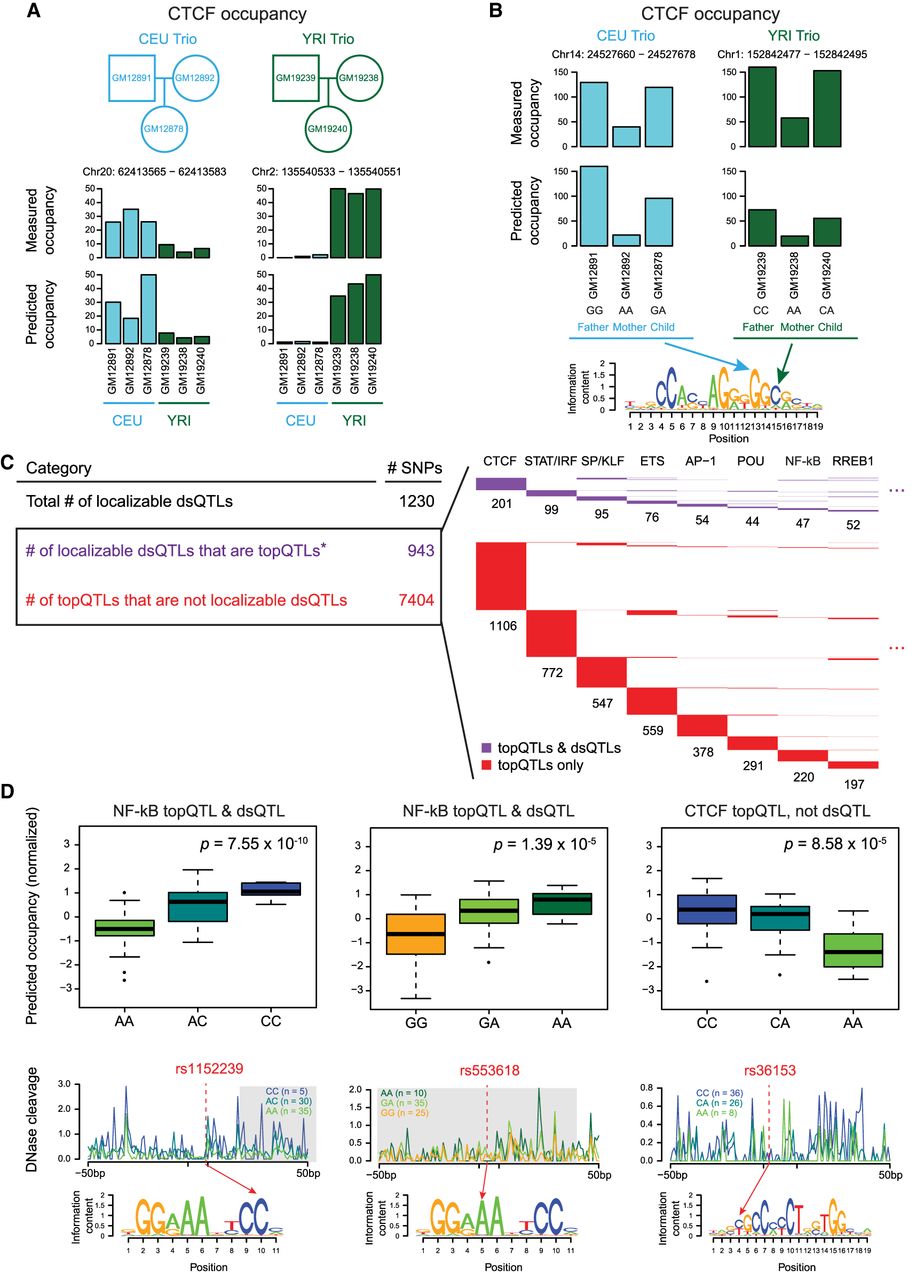
TF occupancy profile QTLs (topQTLs). (A) Measured and predicted CTCF occupancy at two individual-specific example loci with significantly differential CTCF occupancy between CEU and YRI families. (B) Measured and predicted CTCF occupancy at two allele-specific example loci with significantly differential CTCF occupancy within CEU and YRI families. (C) Intersections of topQTLs with “localizable dsQTLs” (those within their own 100-bp windows and also within motif matches). topQTLs were defined with FDR < 10%; (*) with FDR < 20%, the number of localizable dsQTLs that are also topQTLs becomes 1000. (Right) Largest motif clusters for topQTLs are displayed in the matrix; each row represents one topQTL that can be explained by one or more motif clusters in the columns. (D) Examples of topQTLs showing normalized allele-specific predicted occupancy; average DNase digestion profiles within 50 bp of the motif for each allele (significant dsQTL windows shaded in gray); and SNP locations within motifs. The CTCF topQTL overlapped a measured CTCF ChIP-seq peak in multiple LCLs but was not identified as a dsQTL.


