
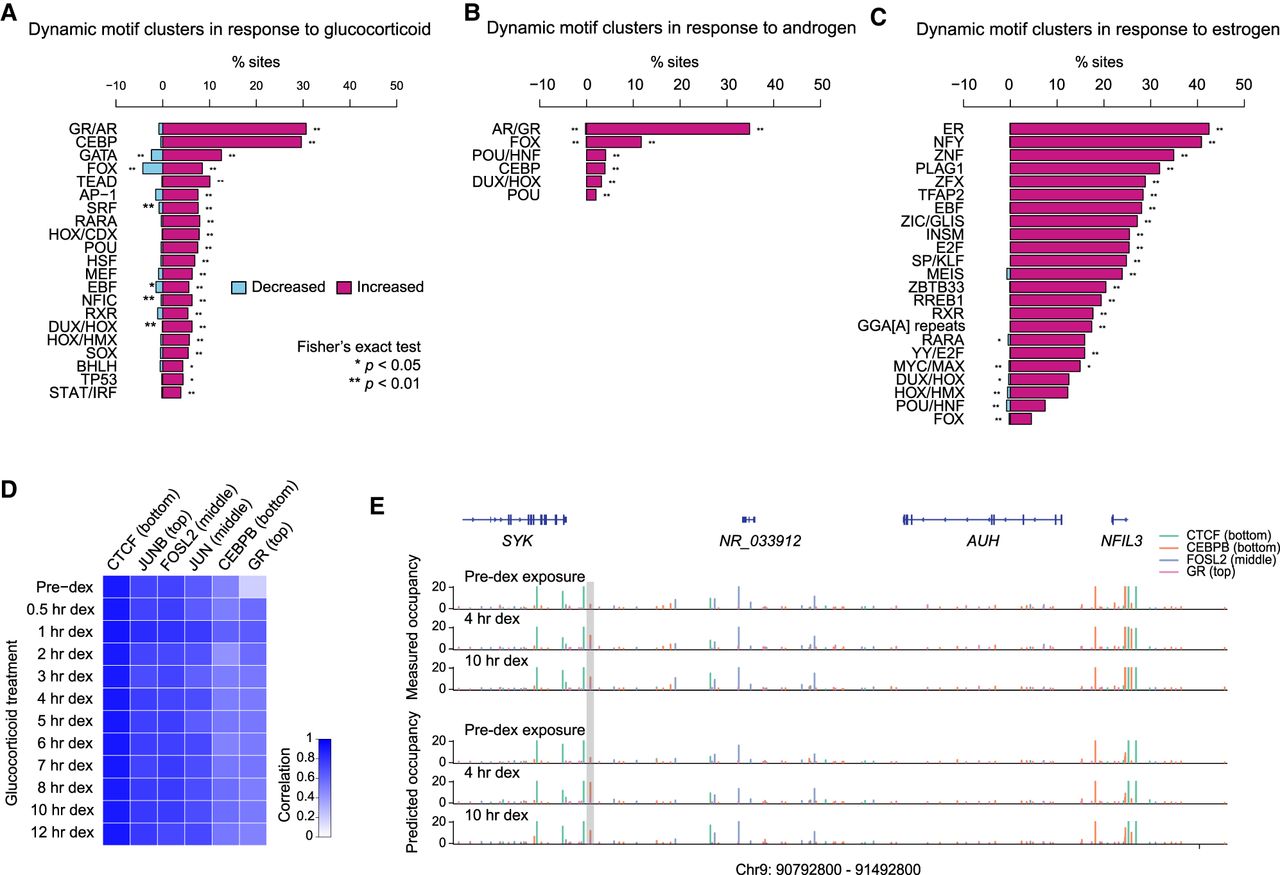
TF occupancy dynamics in response to hormone stimulation. (A) Motif clusters were ranked by the percentage of candidate sites whose predicted occupancy showed either a linear increasing or decreasing trend along the 12 time points of glucocorticoid (GC) treatment. Only significant dynamic motif clusters (P-value < 0.05) are listed. (B) Similar to A, but along the four time points of androgen treatment. (C) Similar to A and B, but before and after estrogen treatment. Because DNase data were collected at 12 time points during treatment with GC, at four time points with androgen, and at only two time points with estrogen, numbers are not necessarily comparable between different experiments in A, B, and C. (D) Prediction accuracy for six TFs was evaluated afterward using subsequently generated ChIP-seq data (McDowell et al. 2018). Shades of blue indicate the correlation between predicted and measured occupancy for each of the six TFs at each time point. Columns (TFs) were sorted by average accuracy across the 12 time points. (E) Measured and predicted TF occupancy landscapes of CTCF, CEBPB, FOSL2, and GR in an example genomic region on human Chromosome 9. Predicted occupancy corresponded well with measured occupancy across time, for example, revealing in the highlighted region how CEBPB occupancy at this site increased following GC treatment.


