
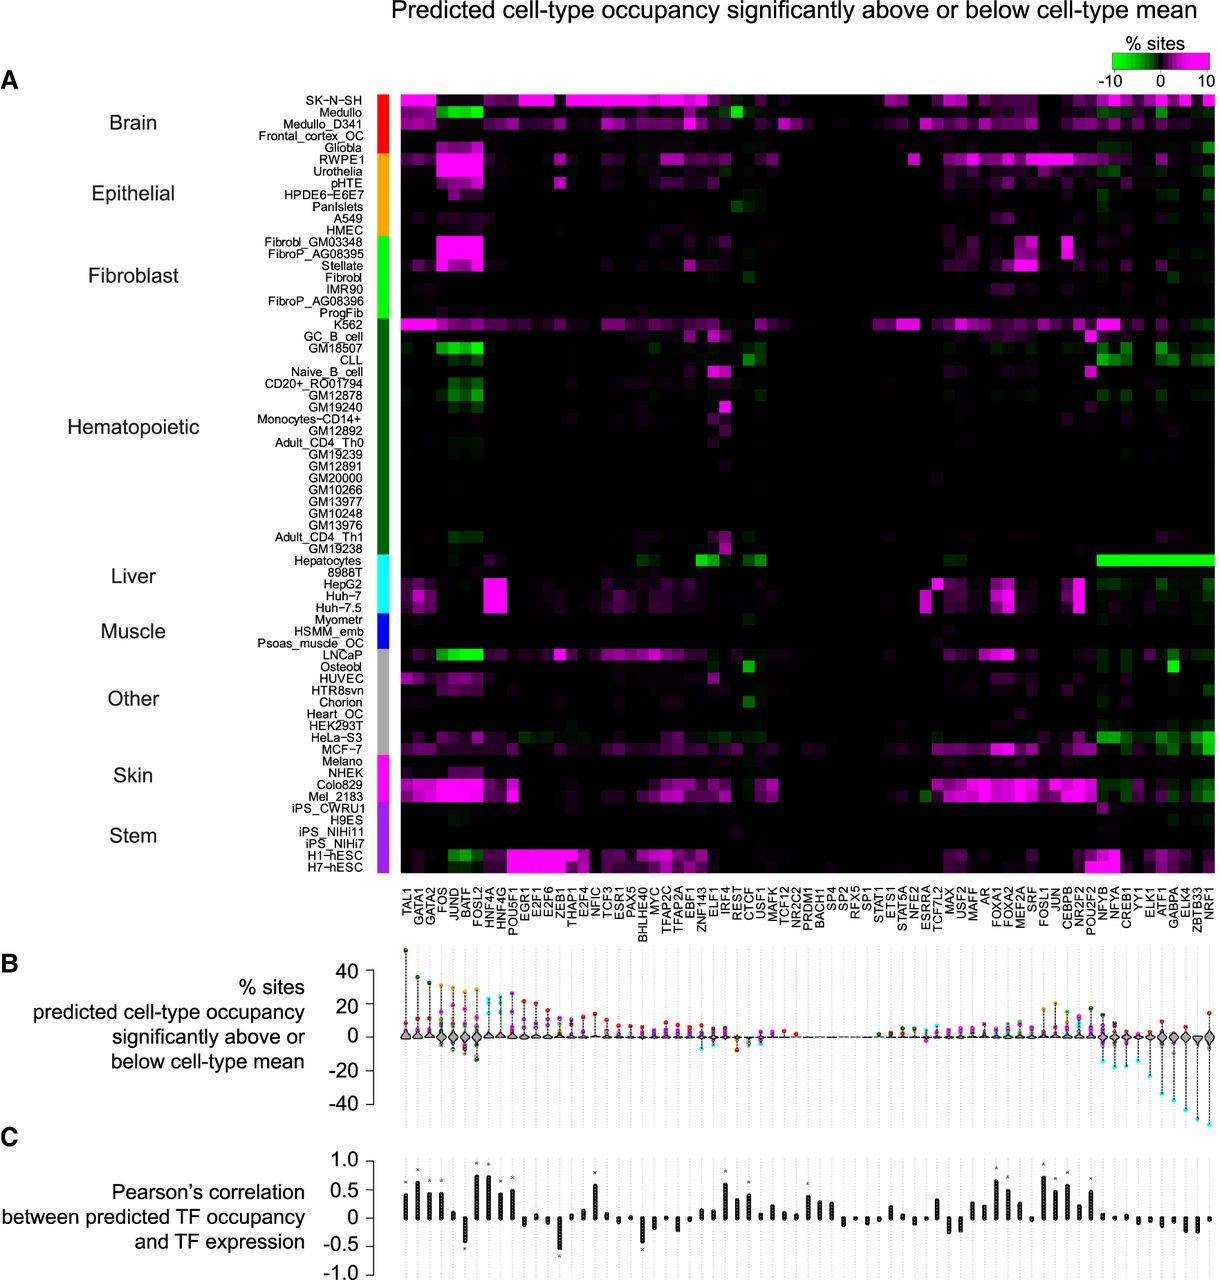
Cell type–specificity matrix of TFs. (A) Percentage of sites with predicted cell type occupancy significantly above or below predicted cell type mean occupancy (FDR < 10%). Cell types were first grouped by lineage (ordered alphabetically) (Sheffield et al. 2013) and, within each lineage group, were ordered by hierarchical clustering. TFs were ordered by hierarchical clustering (with optimal leaf ordering) (Bar-Joseph et al. 2001). (B) Violin plots shown for each TF the distribution across cell types of the percentage of sites showing significantly differential occupancy. Colored dots highlight cell types with at least 3% of sites showing significantly differential occupancy (color reflects lineage of cell type; e.g., liver and brain show frequent differential occupancy). (C) Pearson's correlation across cell types between average predicted occupancy and gene expression of each TF (in this plot, we used only Duke DNase data because corresponding gene expression was measured in each of the cell types).


