
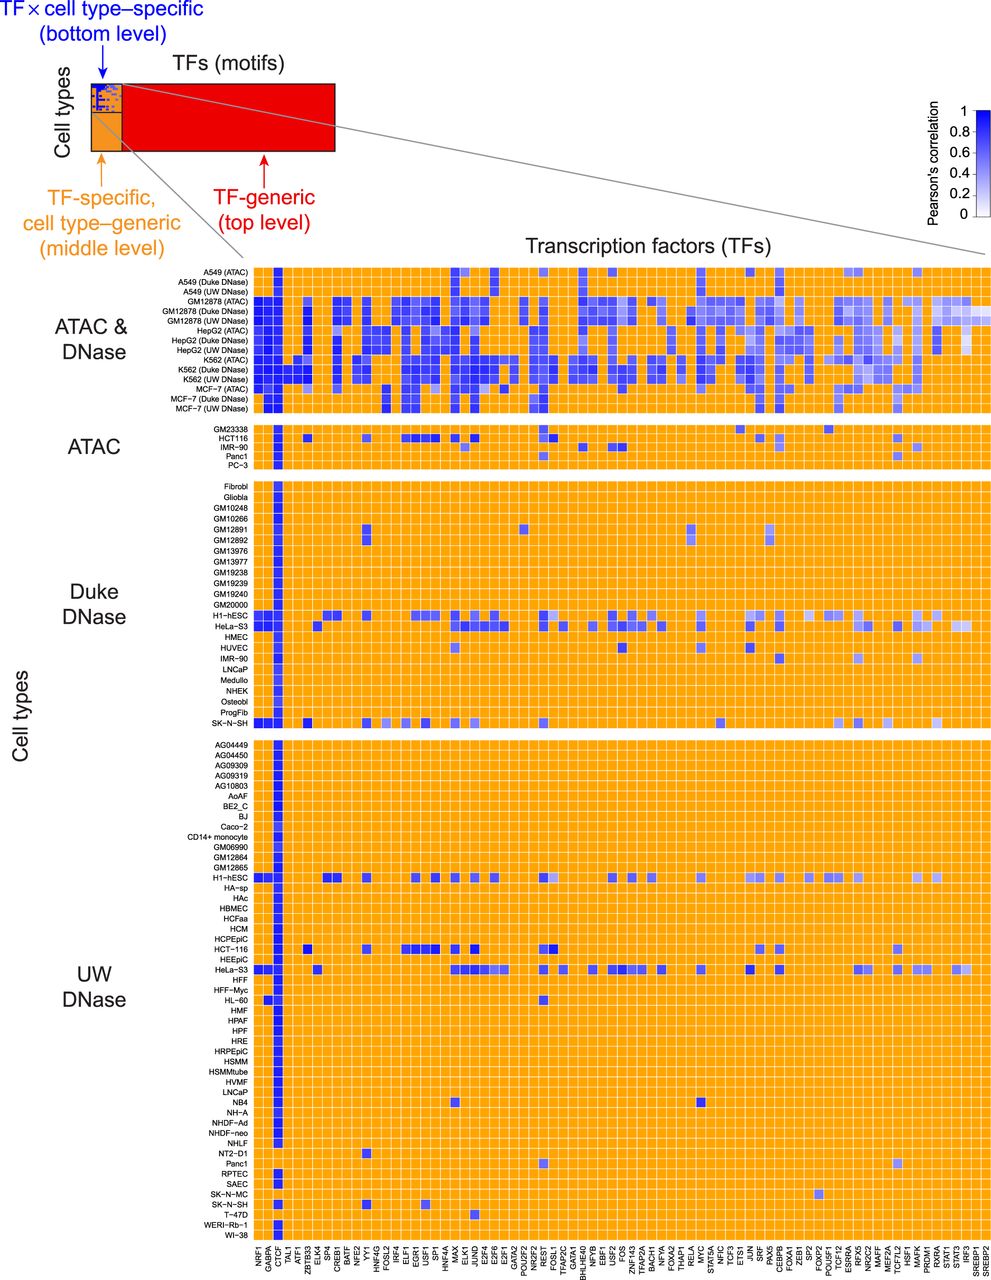
TOP provides quantitative TF occupancy profiles for hundreds of TF motifs across many cell types. (Top, left) Blue squares represent the TF × cell type combinations profiled with ChIP-seq as part of the ENCODE Project. For each of these TFs, we used a middle-level (TF-specific, cell type–generic) TOP model to generate new occupancy predictions across the rest of the cell types (orange squares). We then used a top-level (TF-generic) model to generate new occupancy predictions for the remainder of the TF motifs (red squares). (Zoomed inset) In the case of TF × cell type combinations with available ChIP-seq data, we computed the accuracy of TOP predictions; shades of blue indicate the correlation between predicted and measured occupancy. In this submatrix, TFs (columns) were sorted by average accuracy, revealing a spectrum of predictability. TFs toward the left were on average more predictable, whereas TFs to the right were less predictable.


