
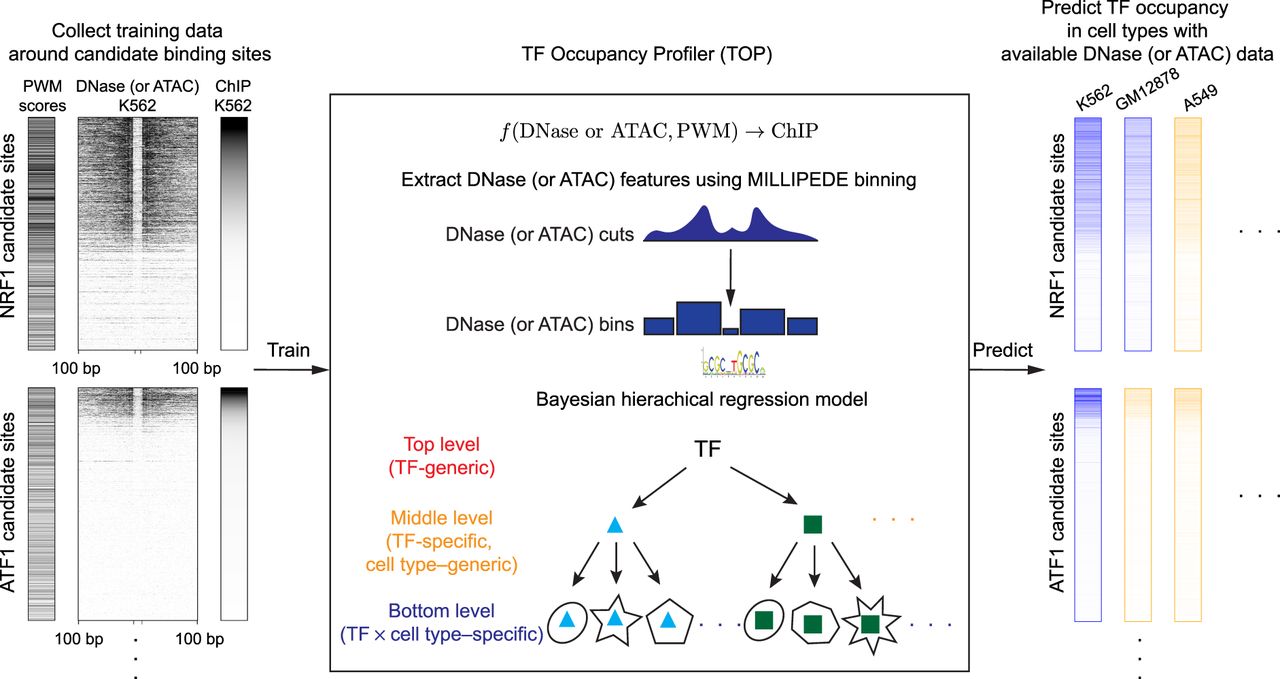
Schematic outline of the TF occupancy profiler (TOP) workflow. (Left) Collect training data. For a sequence-specific TF with a known PWM, compute its candidate binding sites throughout the genome. Then, around each of those sites, collect ChIP-seq and DNase- and/or ATAC-seq data from the same cell type. (Center) Extract DNase or ATAC features using MILLIPEDE binning and fit a Bayesian hierarchical regression model to the training data. Bottom-level models in the hierarchy make predictions in a TF × cell type–specific manner; middle-level models extend prediction in a TF-specific manner to new cell types; and the top-level model extends prediction in a TF-generic manner to new TFs. (Right) Predict TF occupancy at candidate binding sites across cell types. Blue columns indicate a cell type for which ChIP-seq measurements are available, allowing us to evaluate the predictive accuracy of our bottom-level models. Orange columns indicate a cell type for which we make novel predictions of TF occupancy using middle-level parameters of the hierarchical model.


