
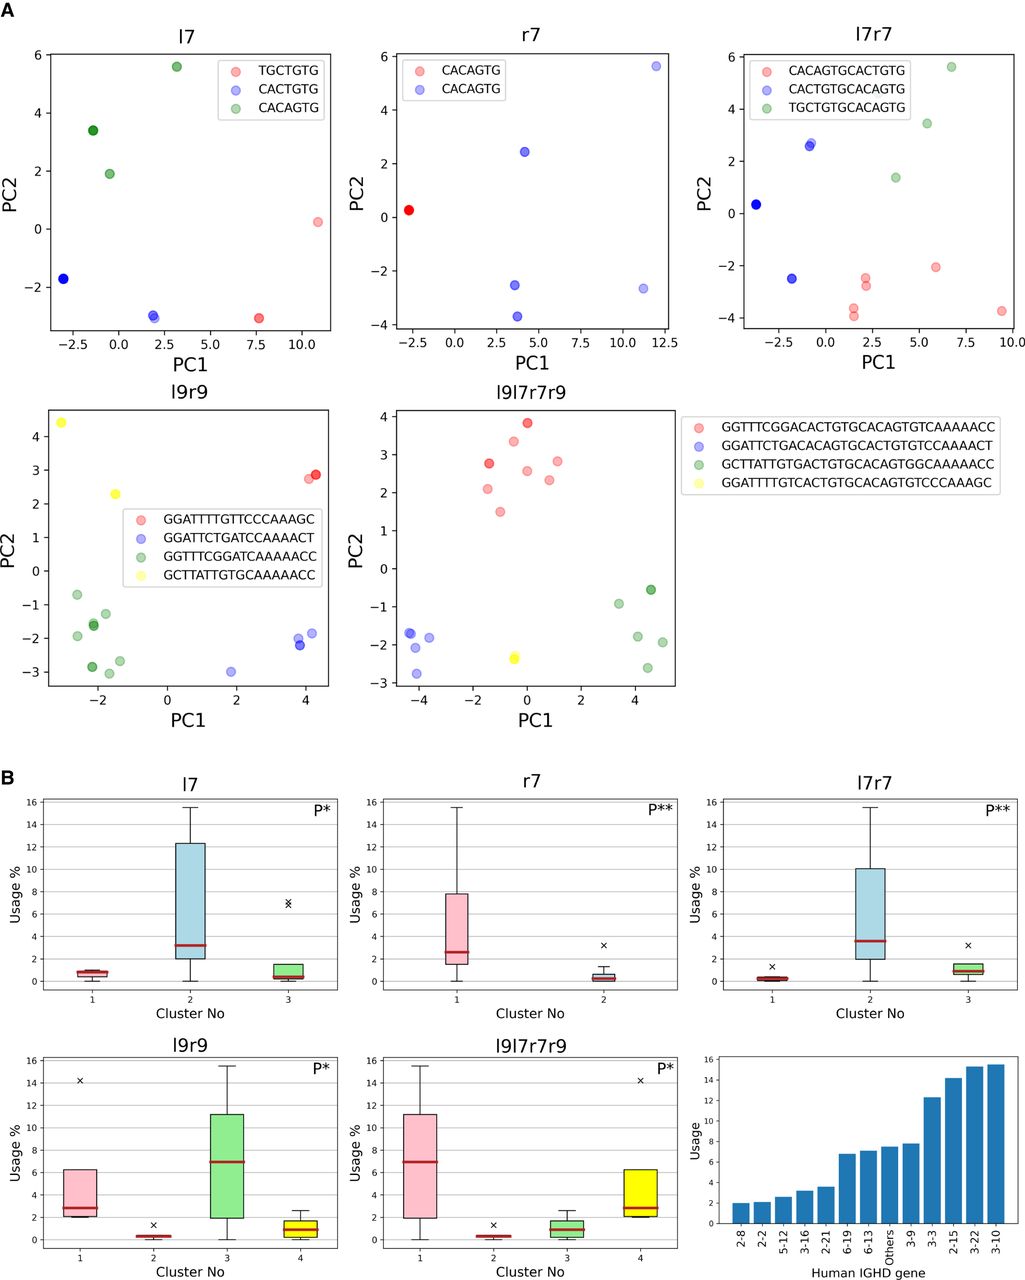
Clustering and distribution of human RSSDs. (A) Cluster visualization of l7, r7, l9l7r7r9, l7r7, and l9r9 signals. We shall henceforth refer to the red, blue, green, and yellow clusters as clusters 1, 2, 3, and 4, respectively. The consensus of a cluster is noted as the legend label. PC1 and PC2 refer to the first two principal components of the clustering performed on the signals, as described in the Results subsection “Variations in RSSs trigger high/low usage of human D genes.” (B) Usage of D genes with respect to clusters on l7, r7, l9l7r7r9, l7r7, and l9r9 signals. The P-value of correlation is depicted on the top right of each panel. (P*) P-value <0.05; (P**) P-value <0.01. (Bottom, right) Usage of human D genes. Each of 12 highly used human D genes (with usage at least 2%) is represented by a single bar. All remaining low-usage human D genes are represented by a single bar, showing their combined usage equal to 7%.


