
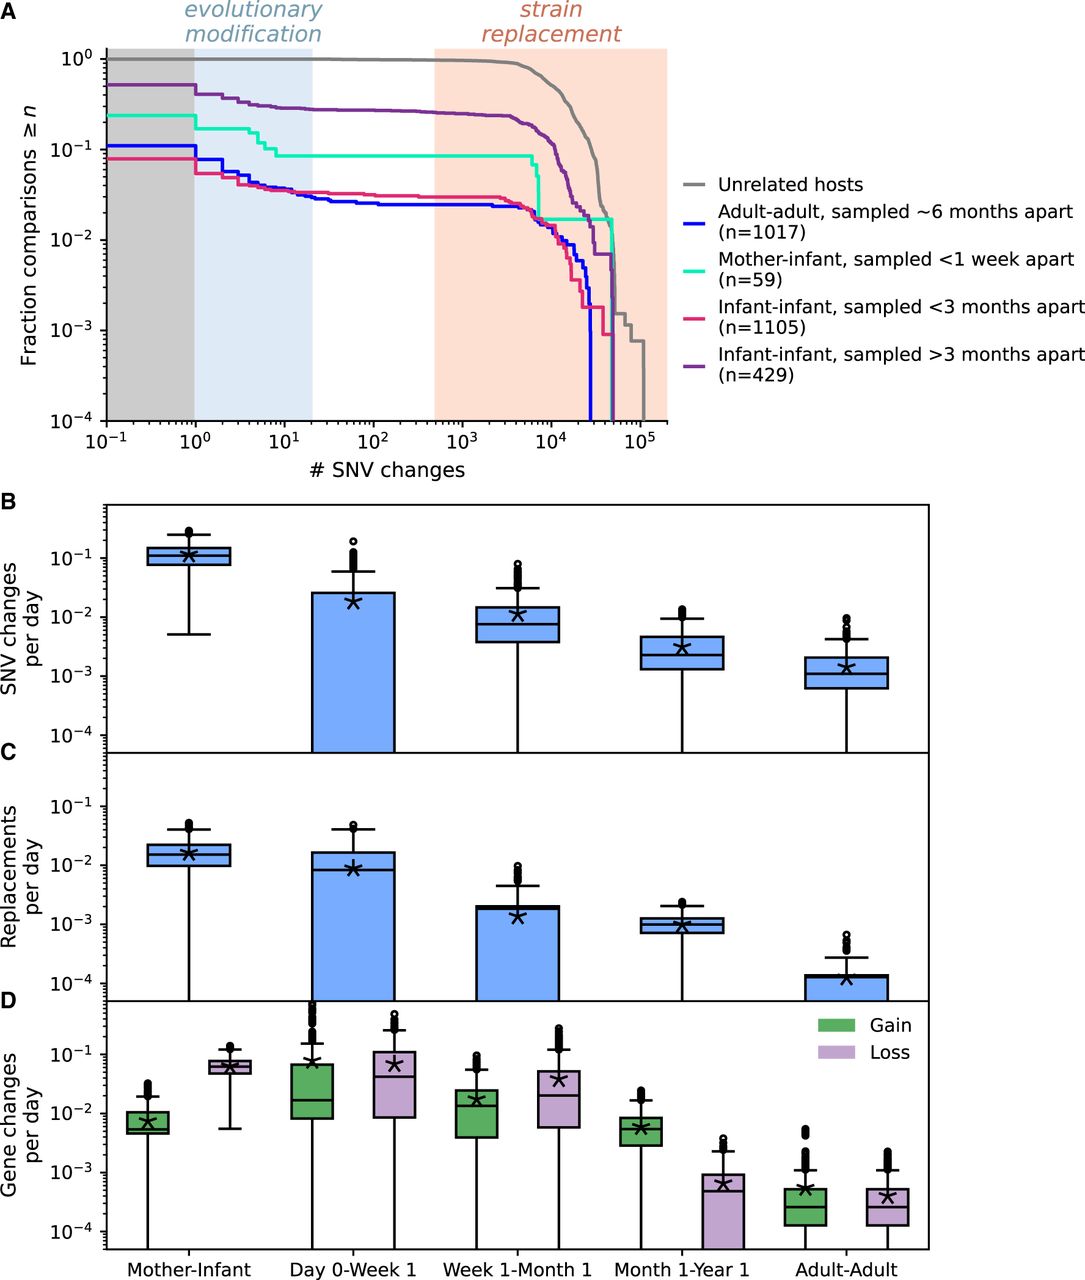
Rates of evolutionary change and replacement decay with life stage. (A) Survival distributions of number of SNV differences (defined as changes in allele frequency from <0.2 to >0.8 between two time points) for each life stage. (B–D) Rates of number of SNV changes per day for QP pairs experiencing evolutionary modification (B), rates of number of strain replacements per day for all QP pairs (C), and rates of gene gains and losses per day for QP pairs experiencing evolutionary modification (D). Asterisks indicate the mean rate computed over all QP pairs in a life stage. To assess variance, rate estimates for each life stage were bootstrapped 1000 times by subsampling with replacement 40 out of all QP pairs available. The mother–infant category only includes comparisons between the mother and her baby sampled within 1 wk of life. To address potential confounding of amount of time between sampling, we compared rates for infants and HMP adults sampled 4–8 mo apart (Supplemental Fig. S10). In B–D, all sample sizes are 53 or more for each life stage. Exact sample sizes and statistical significance of permutation tests comparing all pairs of life stages are reported in Supplemental Table S2. In Supplemental Figure S9, a scaling relationship between changes and life stage is assessed.


