
Figure 1.
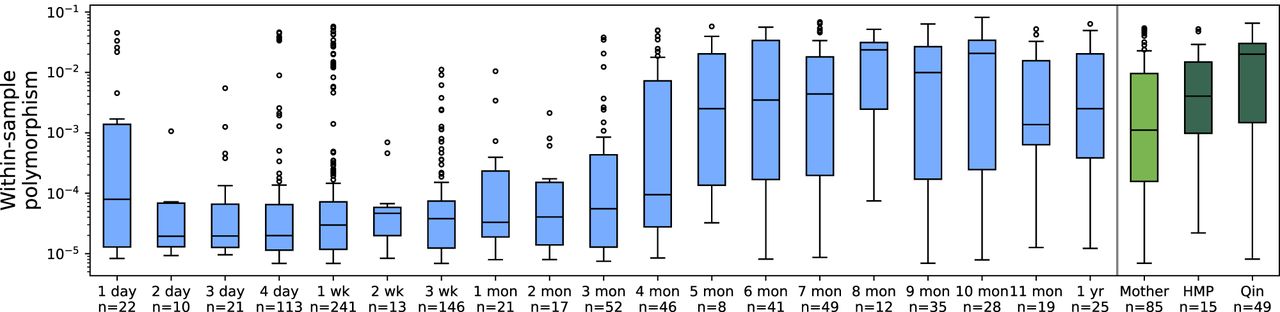
Polymorphism rates for E. coli over the course of the first year of life. Shown are within-sample nucleotide polymorphism rates per base pair for the most prevalent species among infants in our data set, E. coli. Supplemental Figures S4 and S5 show distributions for the next 12 most prevalent species. Here, within-sample nucleotide polymorphism was quantified as the fraction of synonymous sites in core genes with allele frequencies between 0.2 and 0.8 (see Methods).


