
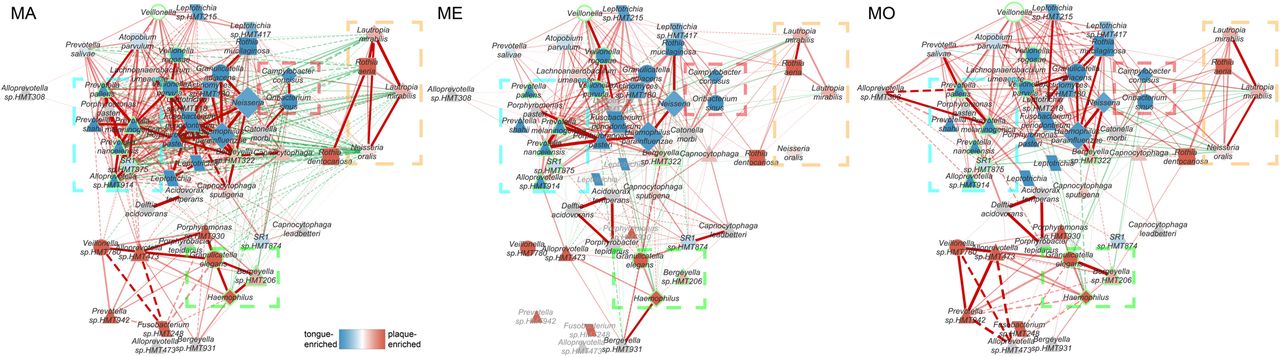
Microbial co-occurrence networks computed with CCLasso in the three individuals. Red and green lines represent positive and negative correlations, respectively. A solid line indicates that the correlation of this pair exists in two or more individuals; a dashed line indicates that the significant correlation is only present in this subject. The size of the node is proportional to the average relative abundance. The shape of the node represents different phyla. The color of the node represents the site preference, in which the blue indicates that the ASV is tongue-specific, and the red indicates the ASV is dental plaque-specific. Gray color means that its site information is not available based on our data. The bold fluorescent green–circled nodes indicate diurnal oscillating ASVs. Gray-colored taxonomy labels indicate that the ASVs do not exist in the current subject.


