
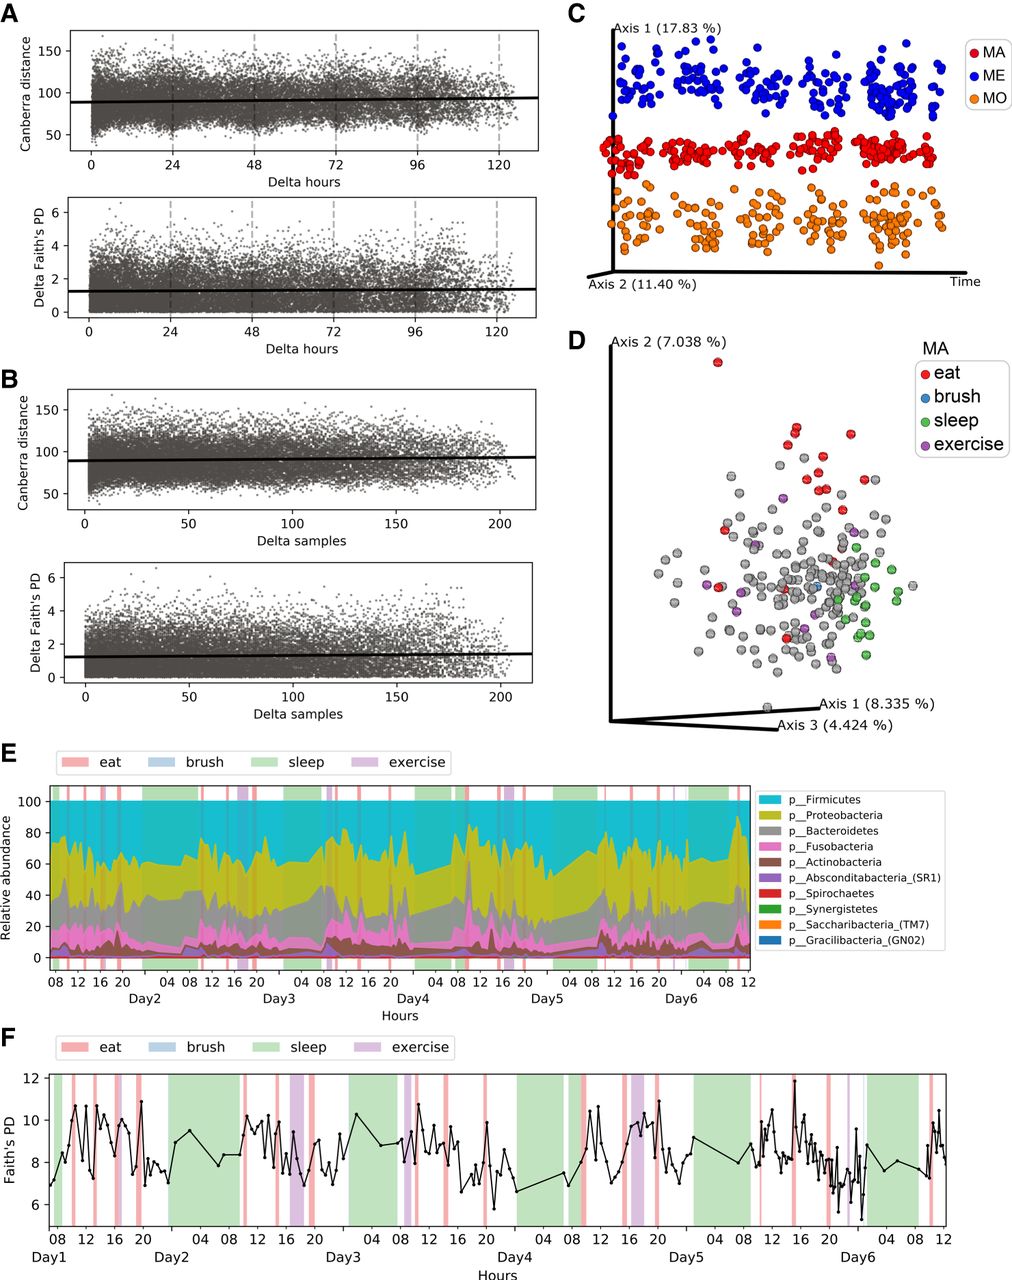
The microbiome overview of densely sampled saliva samples in subject MA. (A,B) The Canberra distance and delta in Faith's PD index between every two salivary samples (measured by time interval in A or sampling efforts in B) showed that our dense sampling protocol does not systematically change microbiome composition. (C) The PCoA plot of three subjects along the sampling time of more than 6 d. Samples were clustered by individuals. (D) The PCoA plot colored by daily activities in MA. (E) Phylum-level taxonomy composition of MA samples along time. (F) Trace plot of alpha diversity in MA. Activity windows are marked in different background colors. Red, blue, green, and purple represent eat, brush, sleep, and exercise activities, respectively.


