
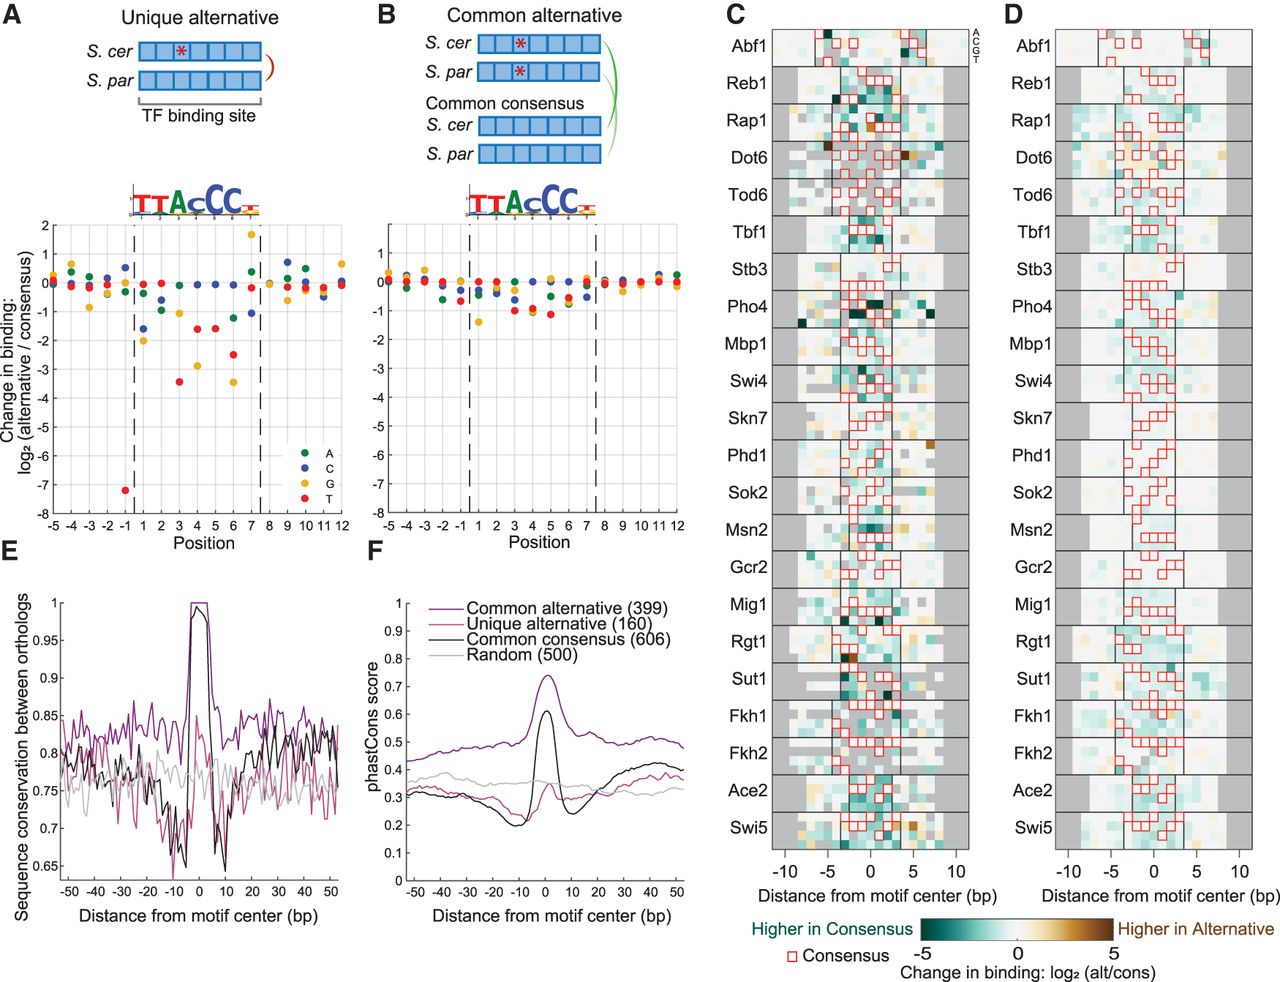
The cost of cis-regulatory mutations on TF binding. (A) The mutation cost of Reb1 measured at unique alternative sites, where one ortholog has the consensus motif (as defined in vitro) and the second ortholog has a one-letter variant (alternative). Each dot represents the mean of at least two sites (for the number of sites, see Supplemental Fig. S9B). Sequence logo of in vitro motif of Reb1 (Fordyce et al. 2010) is presented on top. (B) Mutation cost of Reb1, measured for common alternative sites, where both orthologs have the same one-letter variant. These sites are compared to common consensus sites found elsewhere in the genome. (C) Costs of unique alternatives for 22 TFs. The heatmap represents the change in binding as in A; here, the four rows stand for the four nucleotides A, C, G, T. Red box represents the consensus allele. Minimal two sites, gray color represent missing data. Bases flanking the motif have no consensus sequence, therefore the computation was performed relative to the most common nucleotide. (D) Cost of common alternatives for 22 TFs, as in C. (E) Common alternative binding sites are found at conserved genomic regions. Shown is the sequence conservation between S. cerevisiae and S. paradoxus orthologs (same nucleotide = 1, different nucleotide/ INDEL = 0) at Reb1 binding sites of type: common alternative, unique alternative, and common consensus, as well as in random sites at promoters. Shown is the mean signal per group. The number of sites in each group is indicated in parenthesis. (F) Common alternative sites are conserved through the yeast lineage. The phastCons conservation score (Siepel et al. 2005) is shown for the three Reb1 site groups as in E.


