
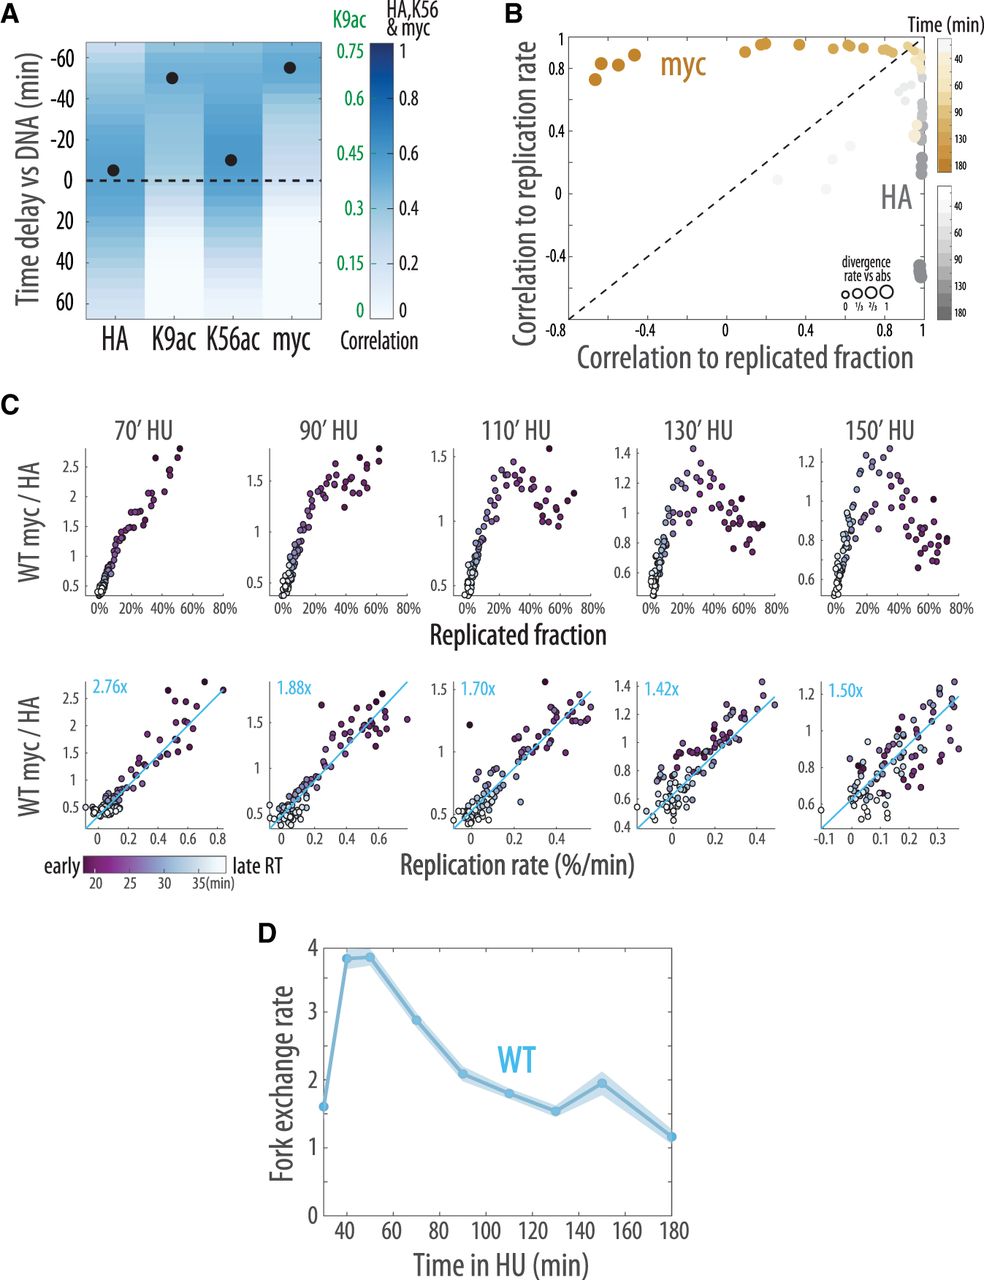
H3 exchange follows replication fork progression. (A,B) Histone incorporation precedes the replication fork and correlates with the replication rate. (A) As in Figure 1E, adding the myc and HA epitope of the exchange sensor marking new and all histones, respectively. Note the different color scales for the epitopes. For additional repeats, see Supplemental Figure S1. n = 4 time courses. (B) myc and HA correlation to replication fraction and rate, analyzed as in Figure 1D. (C,D) Scaling of histone exchange with replicated fraction and replication rate. The genome was clustered based on the annotated RT, and the indicated profile was averaged within each of the 96 clusters (median). (C) The average H3 exchange level (myc/HA) as a function of the replicated fraction (top) or replication rate (bottom). Clusters are colored by their respective RT; time points 70–150 of the time course are shown (for all time points, see Supplemental Fig. S2). The scaling of exchange with the replication rate is summarized in D, displaying the slopes of the linear fits in C (blue lines) (Supplemental Fig. S2). Shading indicates SE (n = 4).


