
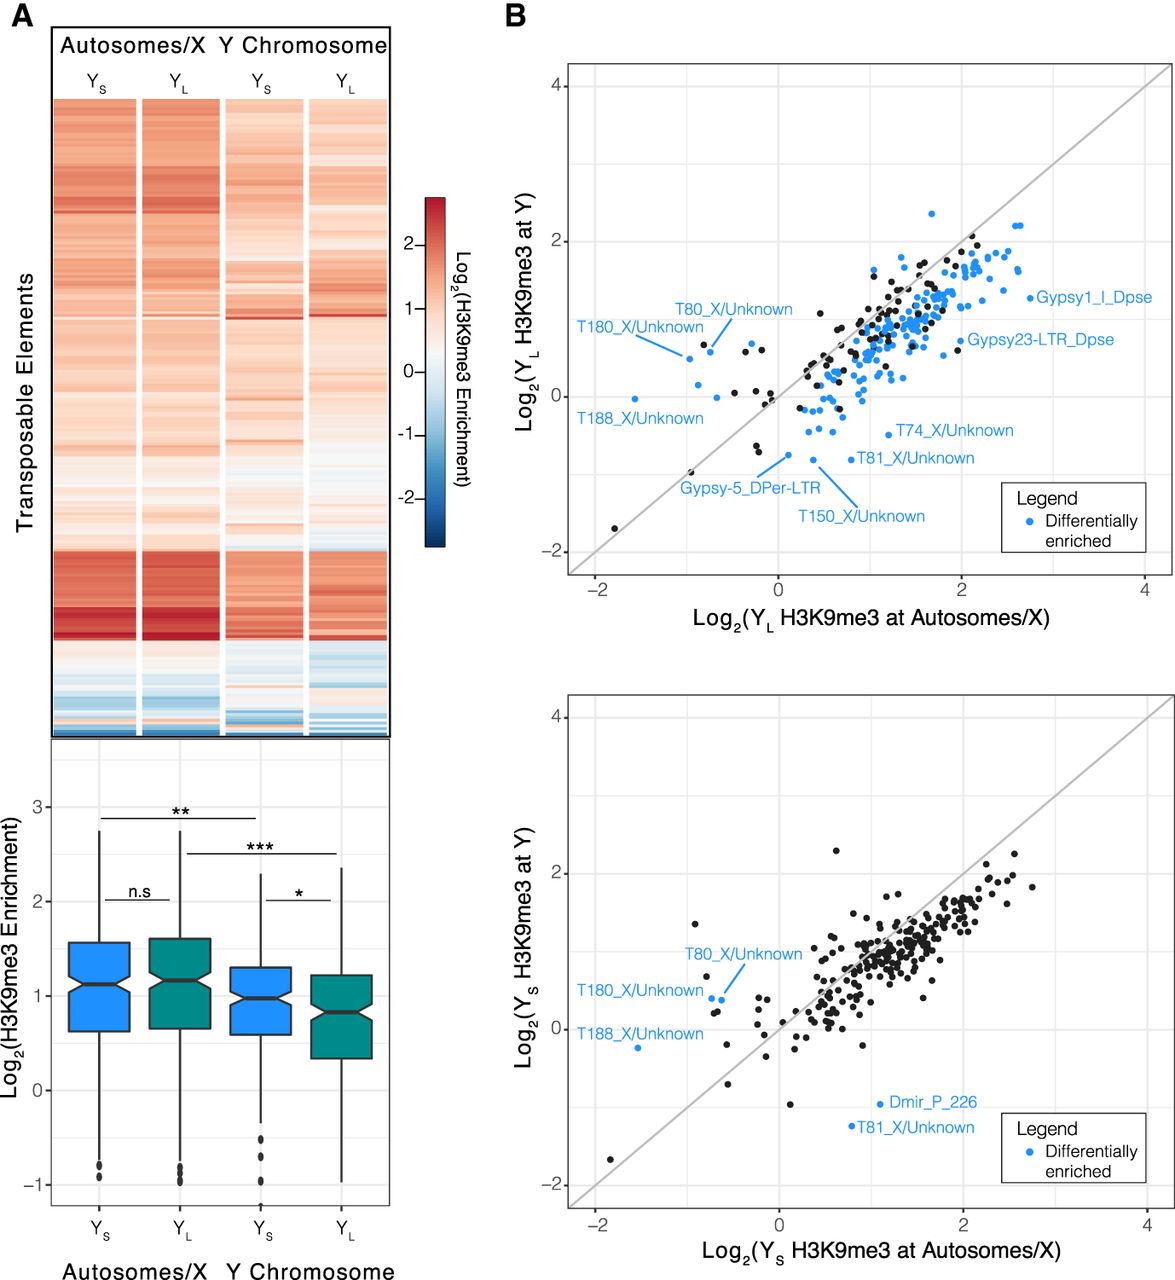
Figure 4.
Decreased H3K9me3 enrichment on YL. (A) Heatmap with corresponding boxplot showing H3K9me3 enrichment at TEs by chromosome (autosomes/X vs. Y Chromosomes). Significance values calculated: (*) <0.05, (**) <0.01, (***) <1 × 10⁻⁵, Wilcoxon test. (B) Scatterplot of H3K9me3 enrichment at TEs by chromosome group for YS and YL (P < 0.05, two-sample t-test). The gray line indicates similar enrichment levels for both chromosome groups.


