
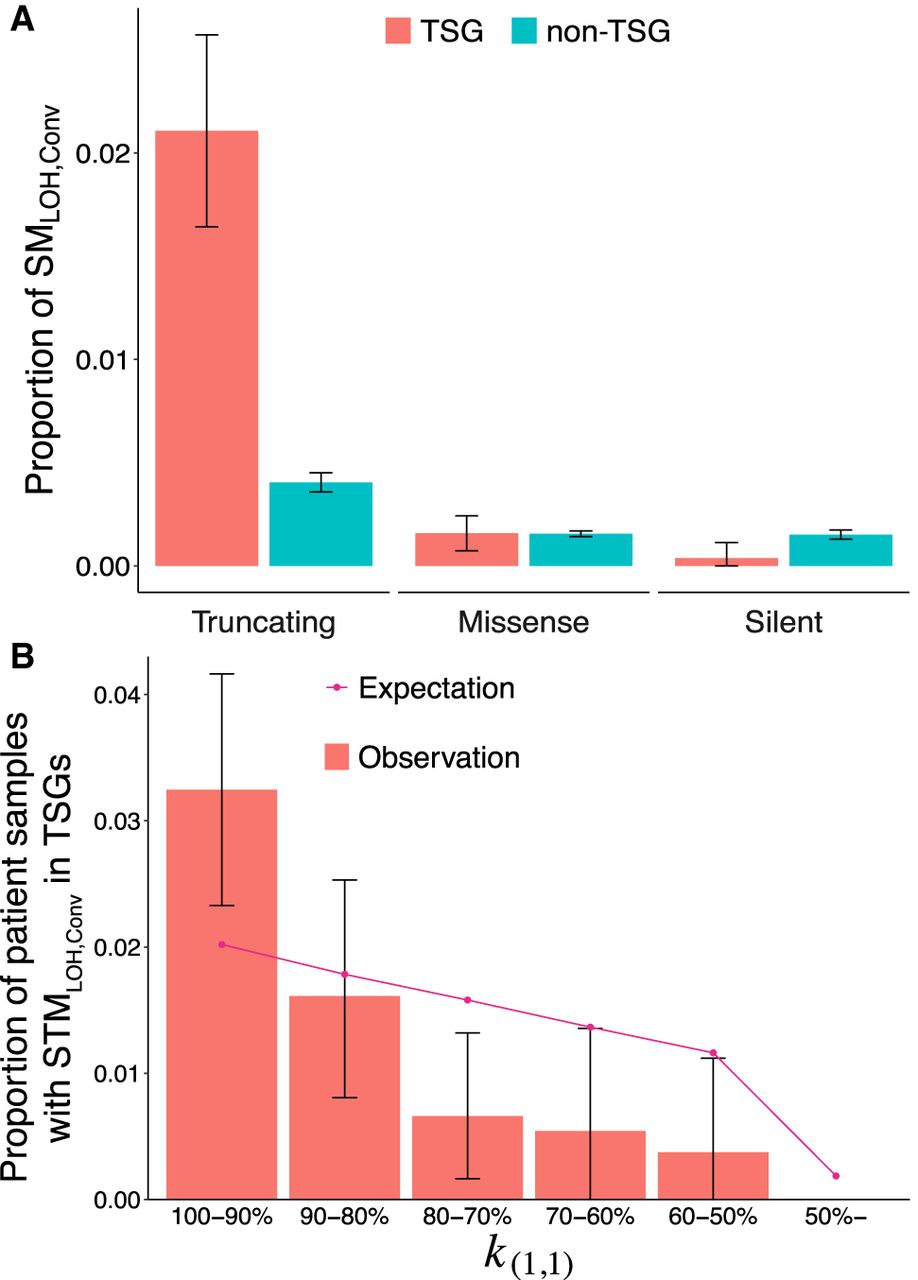
Figure 5.
Rate of gene conversion in TSG. (A) Proportions of SMLOH,Convs in TSGs and non-TSGs. The somatic mutations in regions of (α1, α2) = (1, 1) were classified into the TSG (red) and non-TSG (blue) categories, and the proportion of SMLOH,Conv in each category was calculated. (**) P < 0.01, (NS) nonsignificant. (B) The proportion of patient samples with at least one STMLOH,Conv in TSG is plotted for each category of k(1,1), representing the degree of genome instability. The error bars represent the 95% confidence intervals. The pattern in A holds when the data were separated into k(1,1)-high and k(1,1)-low regions (k(1,1) > 90% and the rest) (see Supplemental Fig. S5).


