
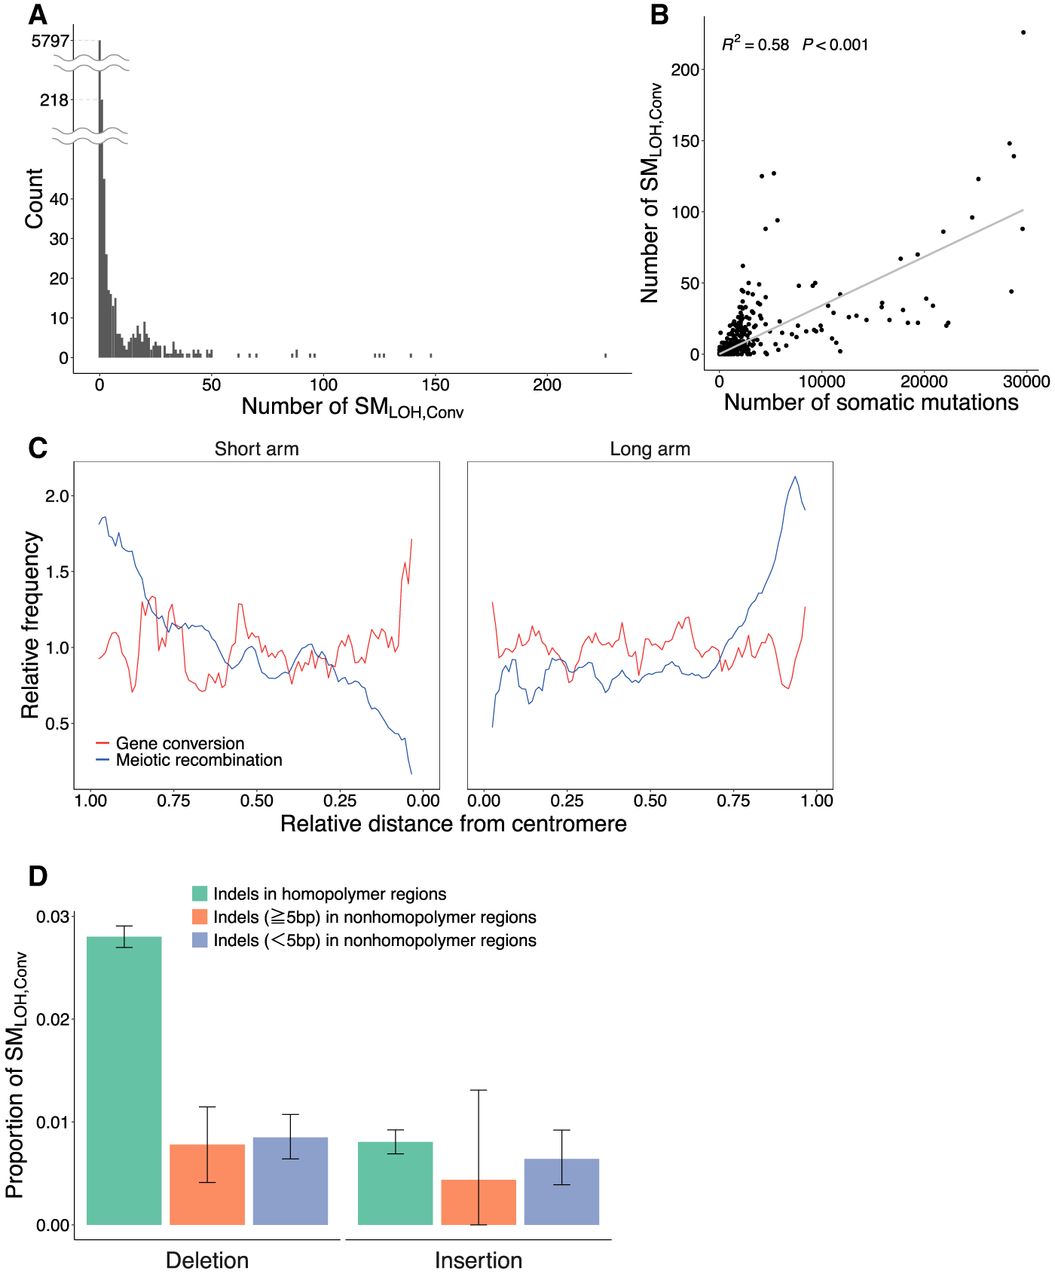
Summary of the observed somatic gene conversion events. (A) Distribution of the number of SMLOH,Convs per patient. (B) Correlation between the total number of somatic mutations and the number of SMLOH,Convs. (C) Distributions of the rates of meiotic recombination and somatic gene conversion along chromosomes. The estimated gene conversion (red line) and the meiotic recombination rates according to the estimates from the HapMap data (blue line) (The International HapMap Consortium 2007) are plotted against the relative distance from the centromere when each chromosome arm is assigned in the interval (0,1). The error bars represent the 95% confidence intervals. The two rates were standardized such that the genome average = 1. (D) Deletion versus insertion bias in SMLOH,Convs. Indels were classified into three categories: indels (≥1 bp) in homopolymer regions, indels with length ≥5 bp in nonhomopolymer regions, and indels with <5 bp in nonhomopolymer regions. Homopolymer regions were defined as those consisting of ≥3 bp of the same nucleotides in a row.


