
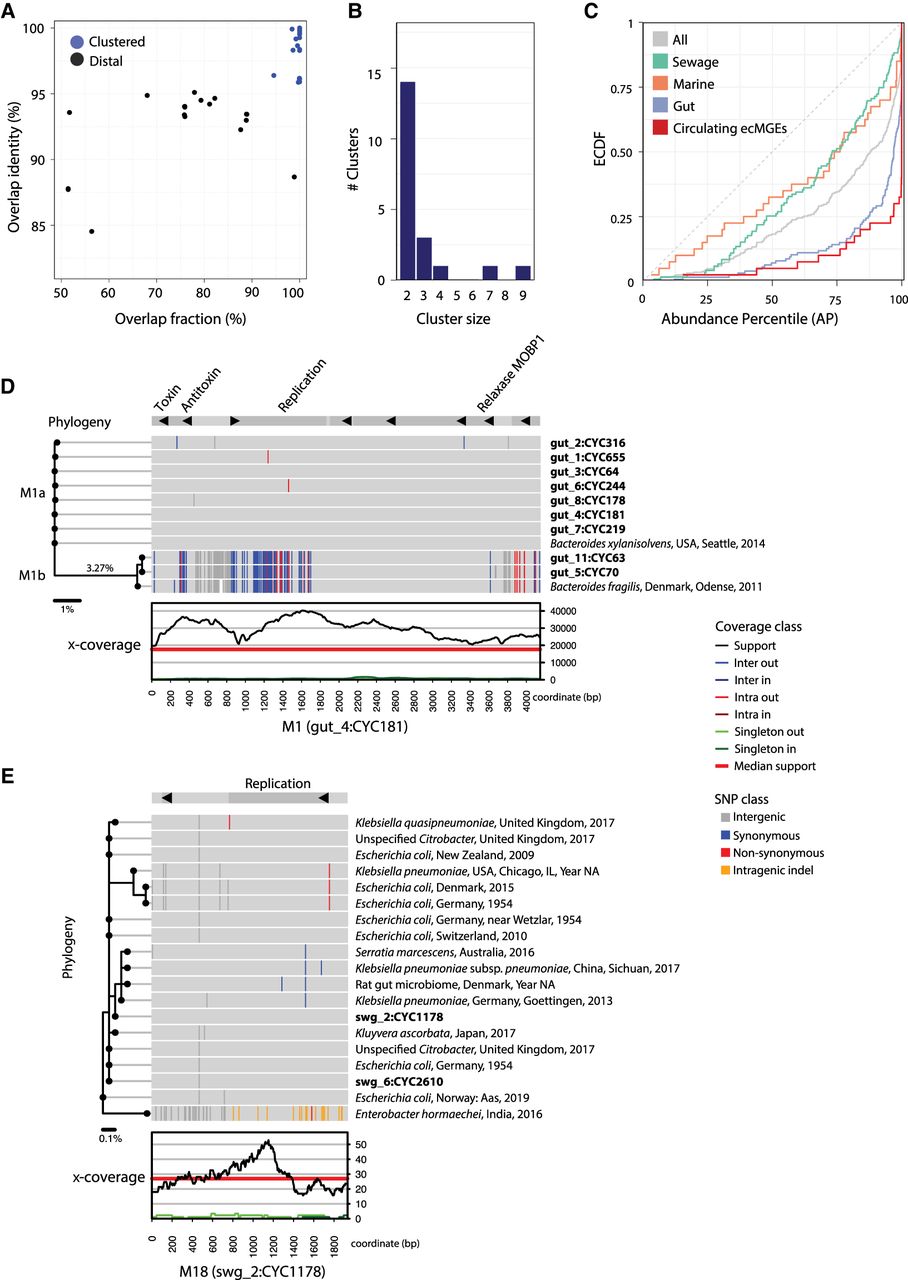
Analysis of circulating ecMGEs. (A) The distribution of cycle tightness metrics across pairs of ecMGEs (>1 kb) in the 32 samples assayed. The overlap identity is defined as the average identity of aligned regions between two cycle genomes. The overlap fraction is defined as the percentage of two cycle genomes that align. For a cycle pair, genomic similarity is defined as the overlap identity times the overlap fraction. Cycle pairs are linked if their genomic similarity is >0.95, and clusters are defined as groups of linked cycles. (B) The distribution of the number of members in clusters. (C) The ECDF of abundance percentile values of circulating ecMGEs compared with ecMGEs stratified by their environment and with all ecMGEs. (D) Detailed view of cluster M1. Data are projected onto a reference “pivot” cluster member (gut4, cycle 181) that is shown in a linear format for visualization purposes. Shown from the bottom up are the x-coverage profiles of the pivot ecMGE member, SNP patterns of cluster members (in bold) and reference sequences (isolate source, location, and year of collection), and annotated genes (on top). SNP patterns are colored according to differences from the pivot, with white indicating segments that failed to align. A phylogenic tree is shown on the left. The units of the scale bar under the tree are mean nucleotide differences. Clades M1a and M1b are marked on the plot. (E) Detailed view of cluster M18, represented as in D.


