
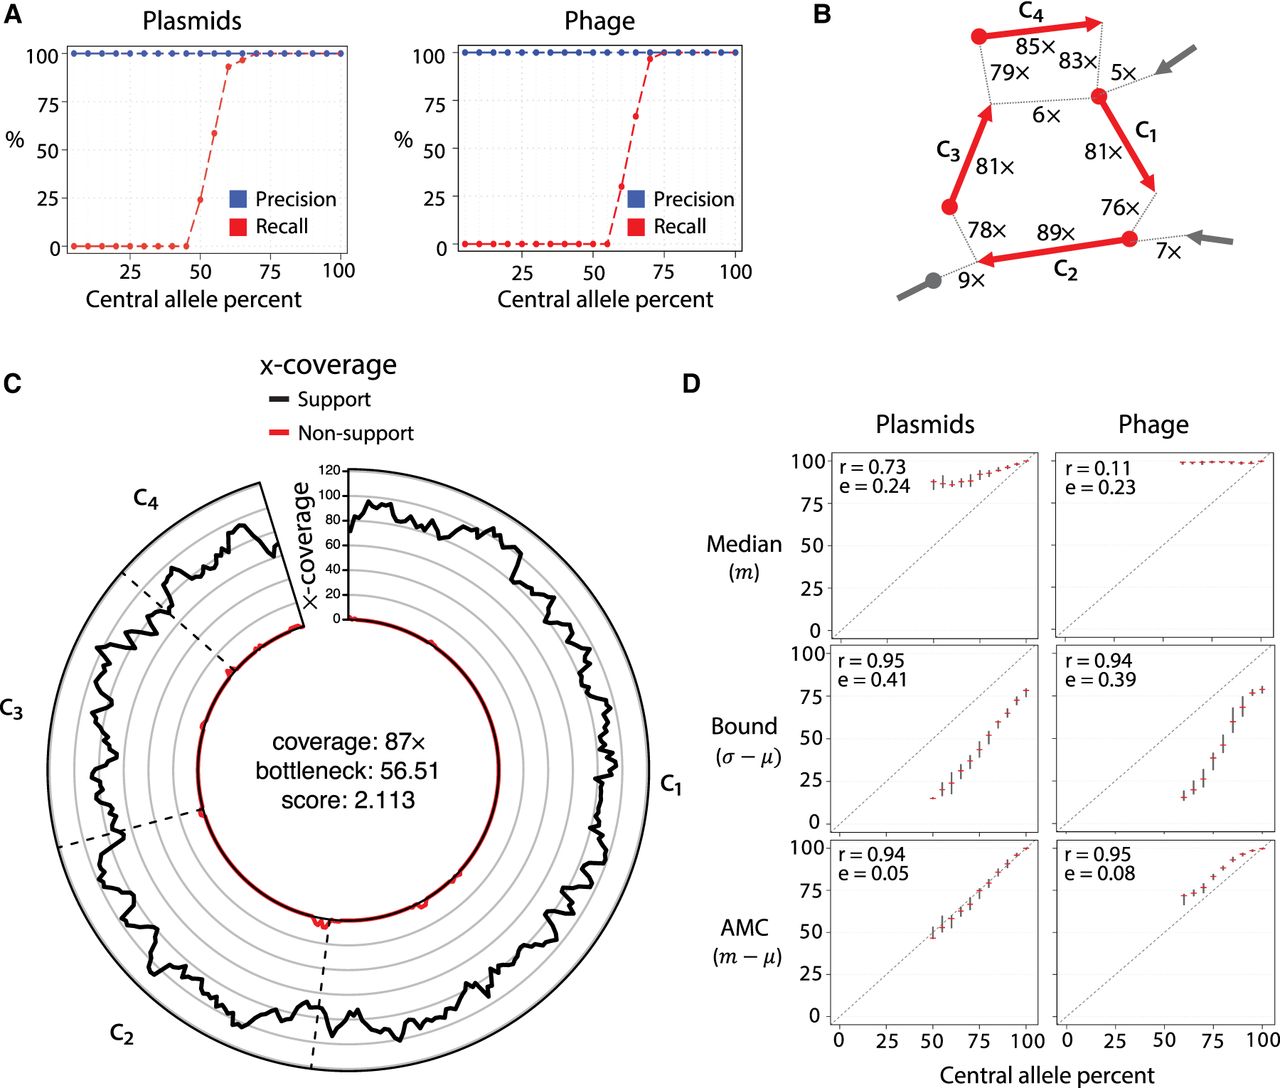
DomCycle performance on recombining plasmids and partially induced phage. (A) The recall (red) and precision (blue) for simulations at varying central allele frequencies. Each point represents the results of 30 trials at a single central allele frequency. Central allele frequency was calculated as the percentage of the total x-coverage contributed by the central allele. (B) Example of a recovered central allele plasmid with a frequency of 55%. Shown is a subset of the assembly graph focusing on a single reported cycle. The graph is represented as in Figure 1C. The recovered cycle is colored in red, and adjacent graph edges that are not part of the cycle are colored in gray. Coverage units show the edge coverage, W(e). Labels on internal edges show contig names. (C) The nucleotide-level cycle coverage profile corresponding to the cycle depicted in panel B. The coverage of cycle supporting reads is colored in black, and the coverage of nonsupporting reads is colored in red. (D) Median coverage, lower bound coverage, and adjusted median coverage (AMC) as predictors of true allele frequency. The Pearson correlation coefficient (denoted with “r”) and root mean squared deviation (denoted with “e”) are shown for each predictor. In each small cross, the horizontal line shows the median metric value of an estimator at a given central allele frequency, and the vertical line depicts the interquartile range of the estimator, created with 30 replicates for each allele frequency. Diagonal dotted lines show the true central allele frequency.


