
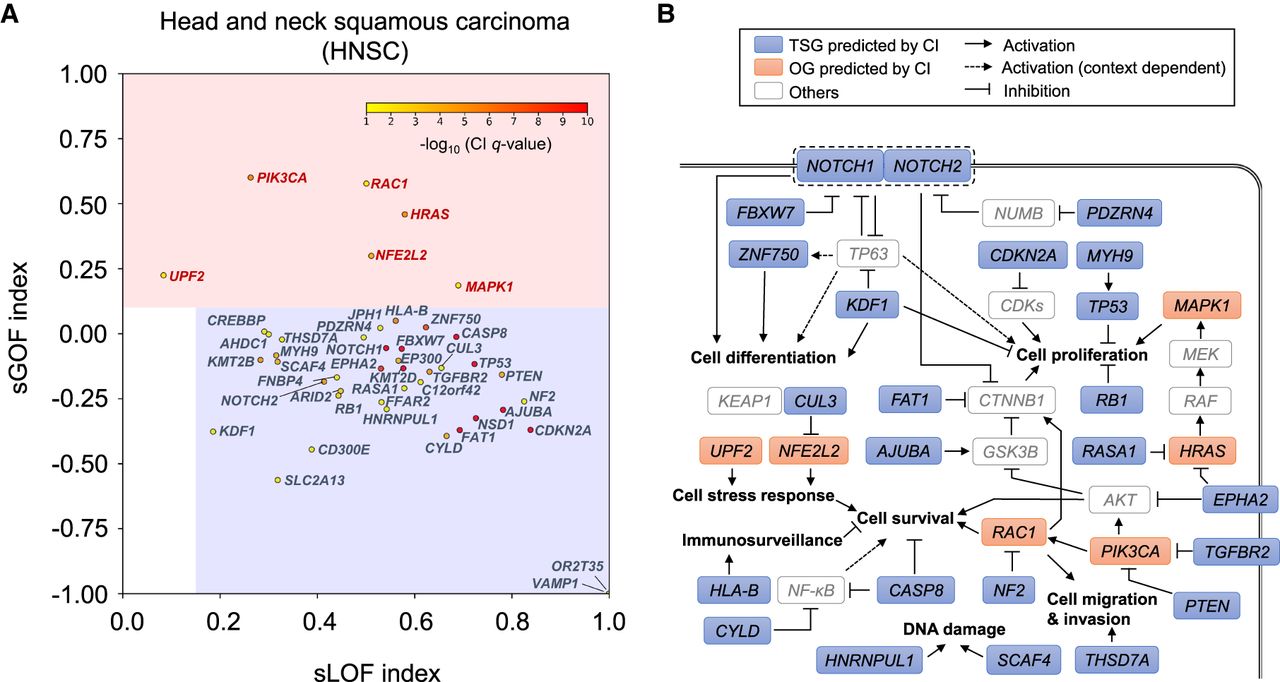
Figure 5.
CI identified 45 genes under positive selection in head and neck squamous carcinoma (HNSC). (A) The 45 HNSC candidate genes were plotted according to their sLOF index (x-axis) and sGOF index (y-axis) as circles. The color of each circle indicates the CI Q-value in HNSC in a color scale of red (more significant) to yellow (less significant). Genes located in the red rectangular area were classified as oncogenes (names shown in red), and genes located in the blue rectangle area were classified as tumor-suppressor genes (names shown in blue). (B) Pathways associated with CI-identified candidates in HNSC.


