
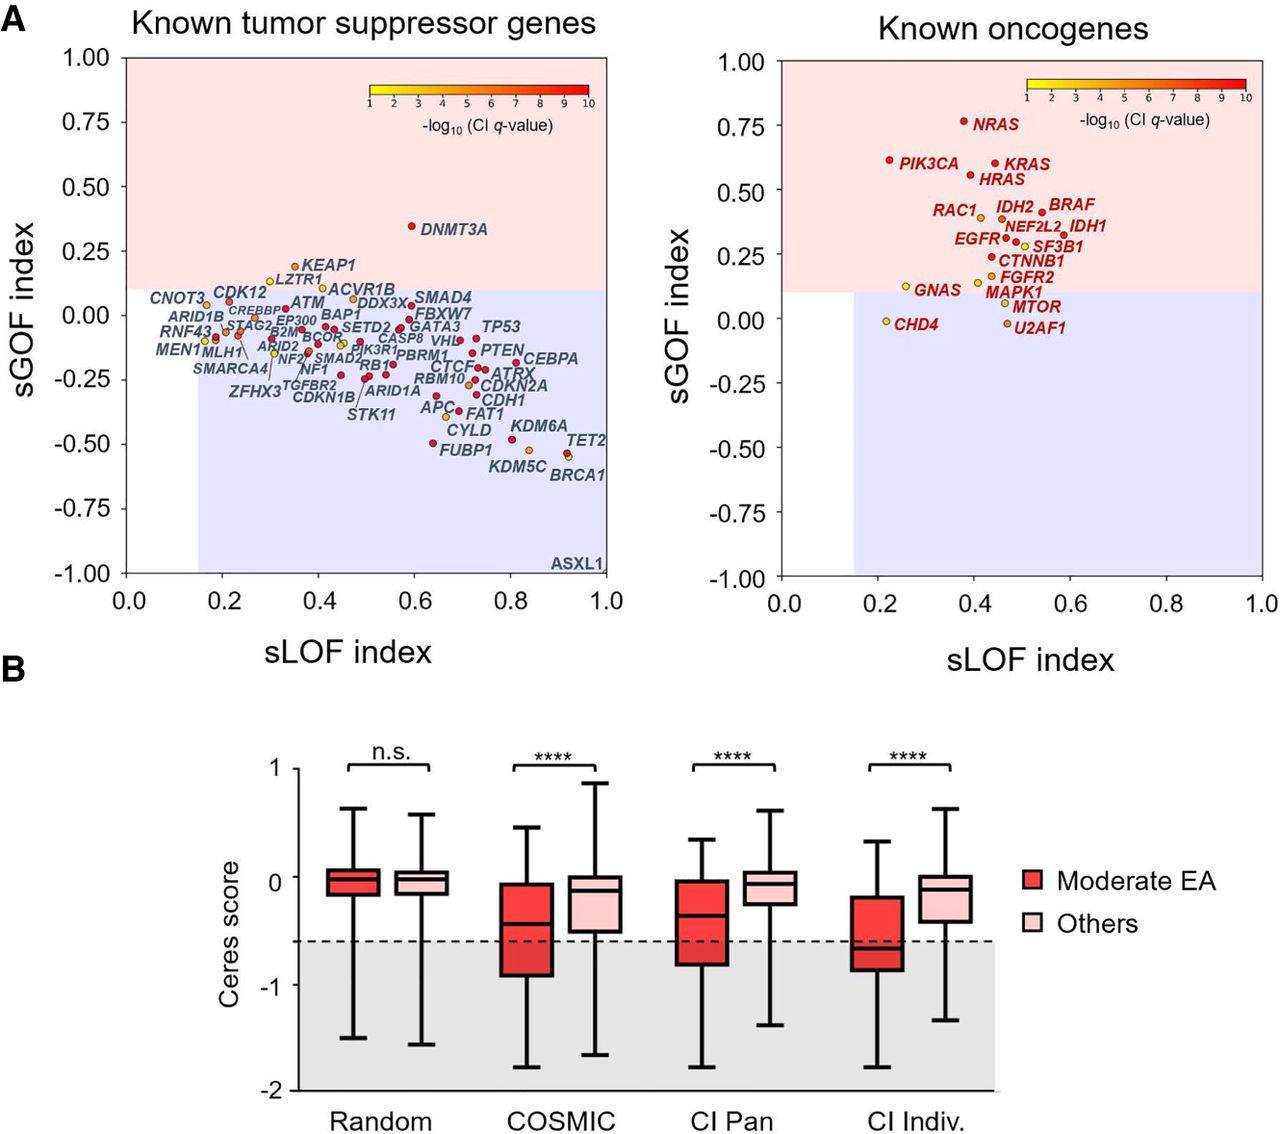
CI distinguished tumor-suppressor genes from oncogenes. (A) The selection for gain-of-function (sGOF) and loss-of-function (sLOF) indices for 54 known tumor-suppressor genes (left) and 18 known oncogenes (right). Genes were plotted according to the sLOF index (x-axis) and sGOF index (y-axis) for the cancer type with the most significant Q-value, and the circle color indicates the CI Q-value for the most significant cancer type, which is represented by a color scale from red (more significant) to yellow (less significant). Genes located in the red rectangular area are classified as oncogenes, and genes located in the blue rectangular area are tumor-suppressor genes. (B) Genome-scale CRISPR gene-dependency screen–validated CI oncogenes. Oncogenes from the COSMIC database (COSMIC), oncogenes identified by the CI method across all cancers (CI PAN), or oncogenes from individual cancer types (CI Indiv.) show a statistically significant shift toward essentiality (Ceres score ≤ −0.6) when harboring variants of moderate EA range (30 ≤ EA score < 70) as opposed to other mutations, including low EA variants (0 ≤ EA < 30), high EA variants (70 ≤ EA < 100), nonsense variants, and other uncategorized variants. No difference was observed for random genes. Statistical significance was calculated with a Mann–Whitney U test.


