
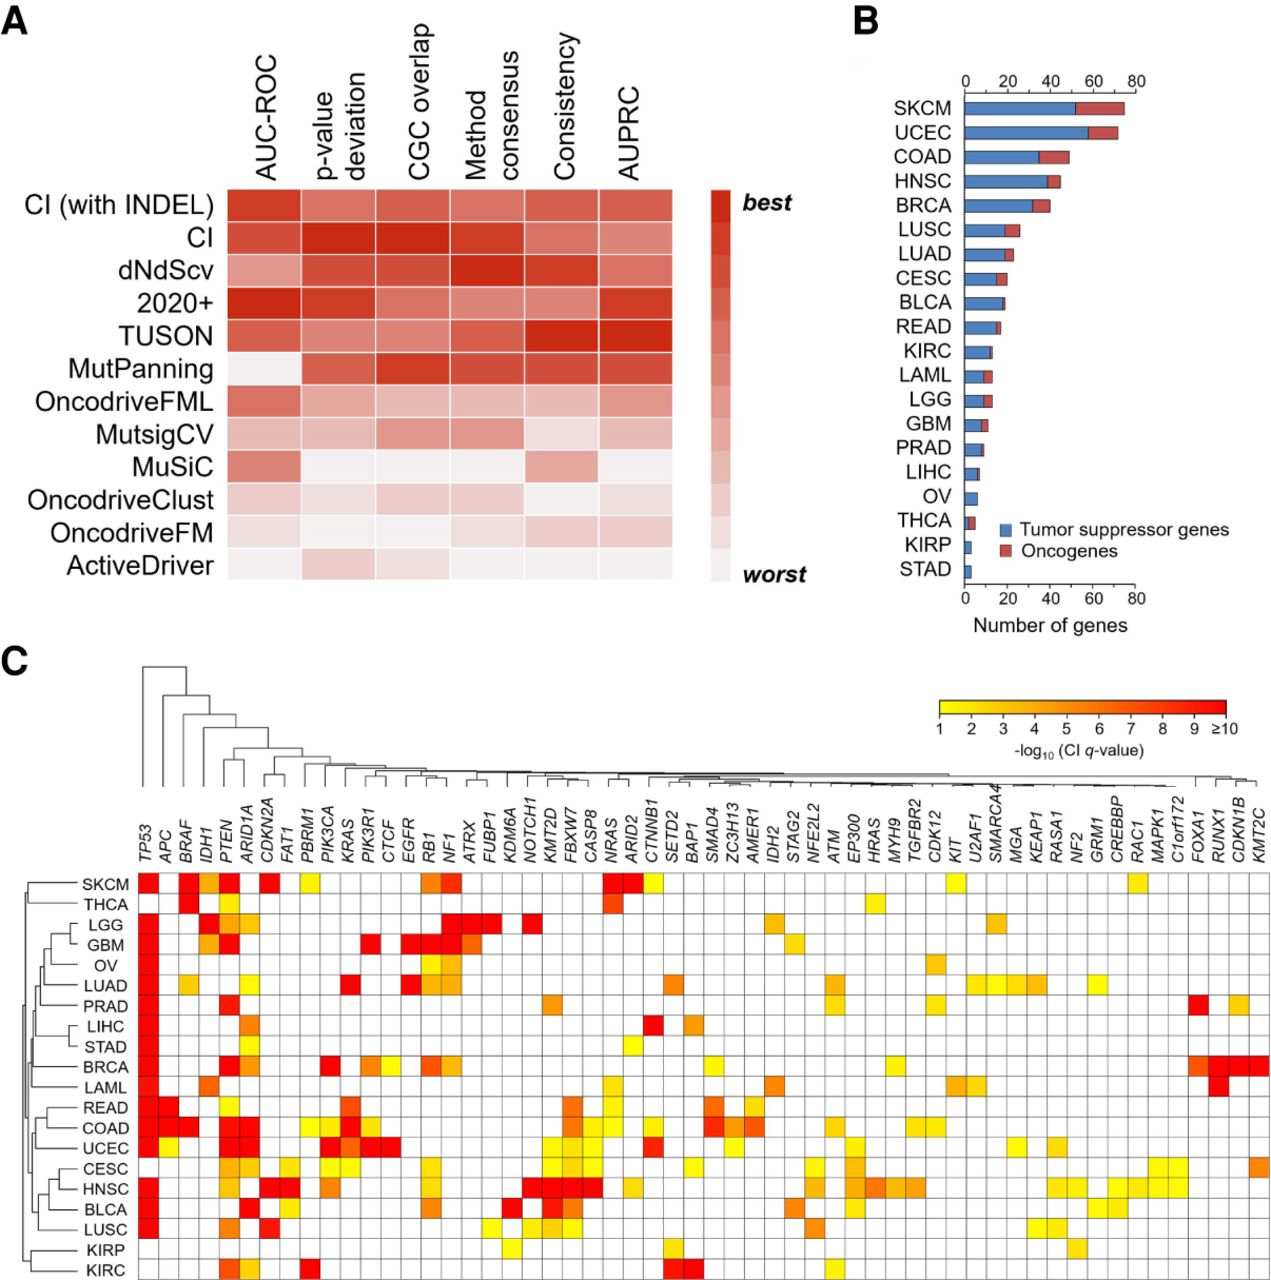
CI recovers cancer-driving genes in benchmarking and prospective analyses. (A) The performance of CI against 10 state-of-the-art methods over the same input samples. The heatmap represents the relative performance of the methods (red means the best, and white means the worst performance) for six evaluation metrics: area under the receiver operating characteristic curve, deviation from the expected P-value distribution, overlap with the COSMIC Cancer Gene Census, overlap with the consensus of all the other methods, the consistency among cohort subsamples, and the area under the precision-recall curve. (B) CI identified 460 genes under positive selection in TCGA tumors. The number of tumor suppressors (blue) and oncogenes (red) identified by CI in each cancer type. (C) Heatmap representation of CI Q-value of the 56 candidate genes that were identified in two or more cancer types. The significance level is represented by a color scale from red (more significant) to yellow (less significant). The cancer types were ordered according to a dendrogram of pairwise distances based on the overlap of predicted driver genes (see Methods).


