
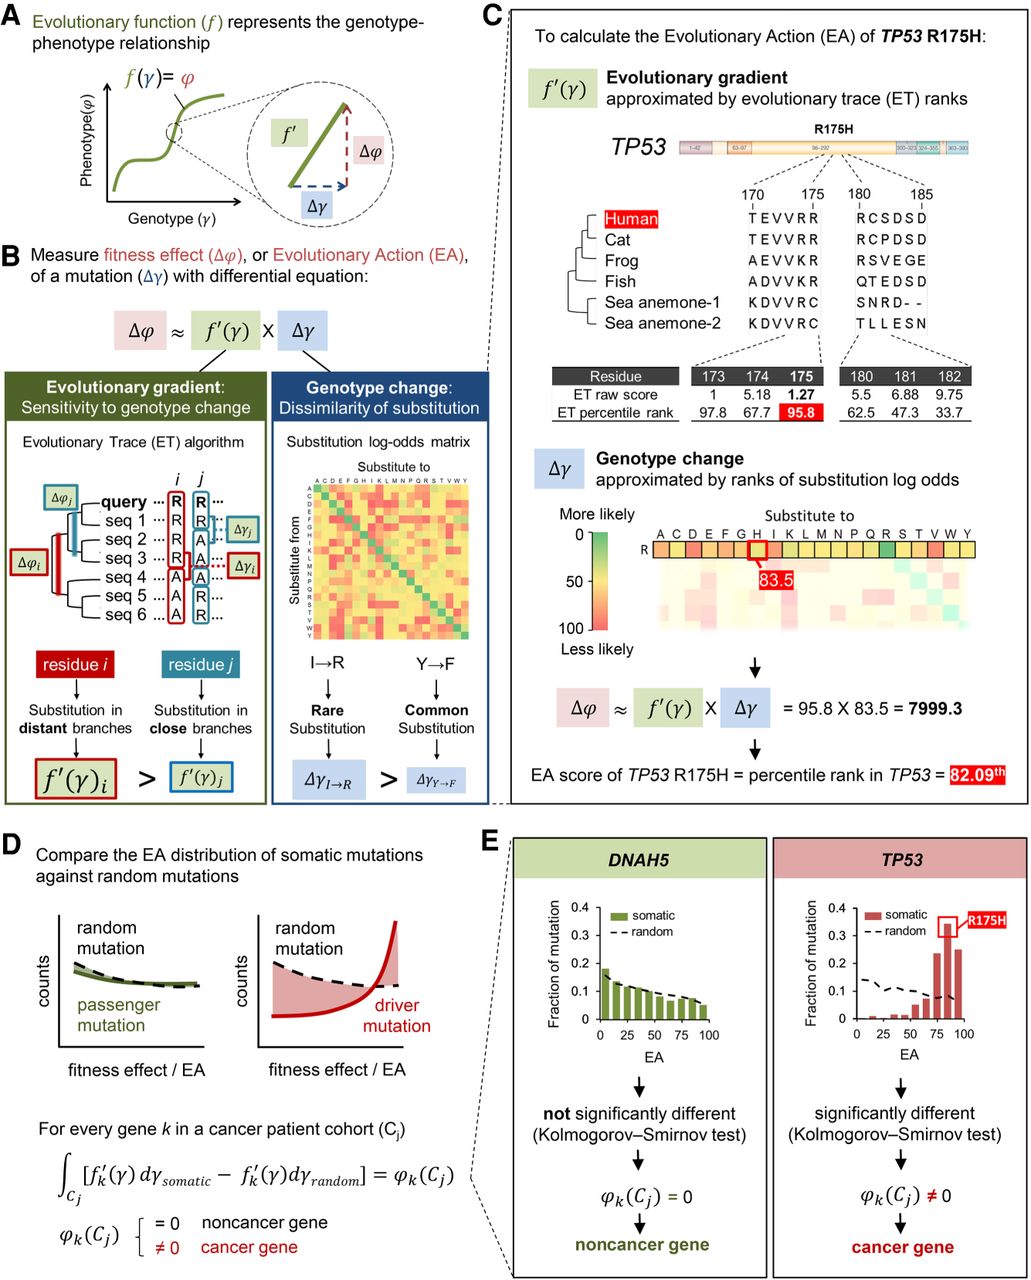
Evolutionary calculus of the genotype–phenotype relationship. (A) Our hypothesis is that the genotype (γ) is linked to phenotype (φ) through a continuous evolutionary function (f). (B) The fitness effect (Δφ), or evolutionary action (EA), of each mutation is the product of evolutionary gradient (f′) and genotypic change (Δγ). Evolutionary gradient is the sensitivity of the mutated position to substitution approximated by evolutionary trace (ET), which accounts for the phylogenetic distances between homologous sequences (Δφ) that vary at a residue position (Δγ); the size of genotypic change can be approximated by substitution odds. (C) EA score calculation for the R175H variant of TP53. The evolutionary gradient (f′) of position 175 was measured by ET ranks of importance, and the genotypic change (Δγ) of R-to-H substitution was measured by ranks of context-dependent substitution log-odds. These two terms were then multiplied and normalized to yield the EA score. (D) To identify genes under positive selection in a trait-associated cohort, for every gene k, we compared the cohort integral, represented by the distribution of EA scores, of its cancer somatic mutations in the patient cohort (Cj) with the cohort integral of random mutations. A nonrandom cohort integral indicates the gene k harbors cancer-driver mutations and therefore is a cancer-driver gene. (E) Cancer-driver genes are identified by nonrandom cohort integrals. Cohort integral of somatic mutations was significantly different from random (one-tailed two-sample Kolmogorov–Smirnov test) for the cancer gene TP53, in contrast to the noncancer gene DNAH5.


