
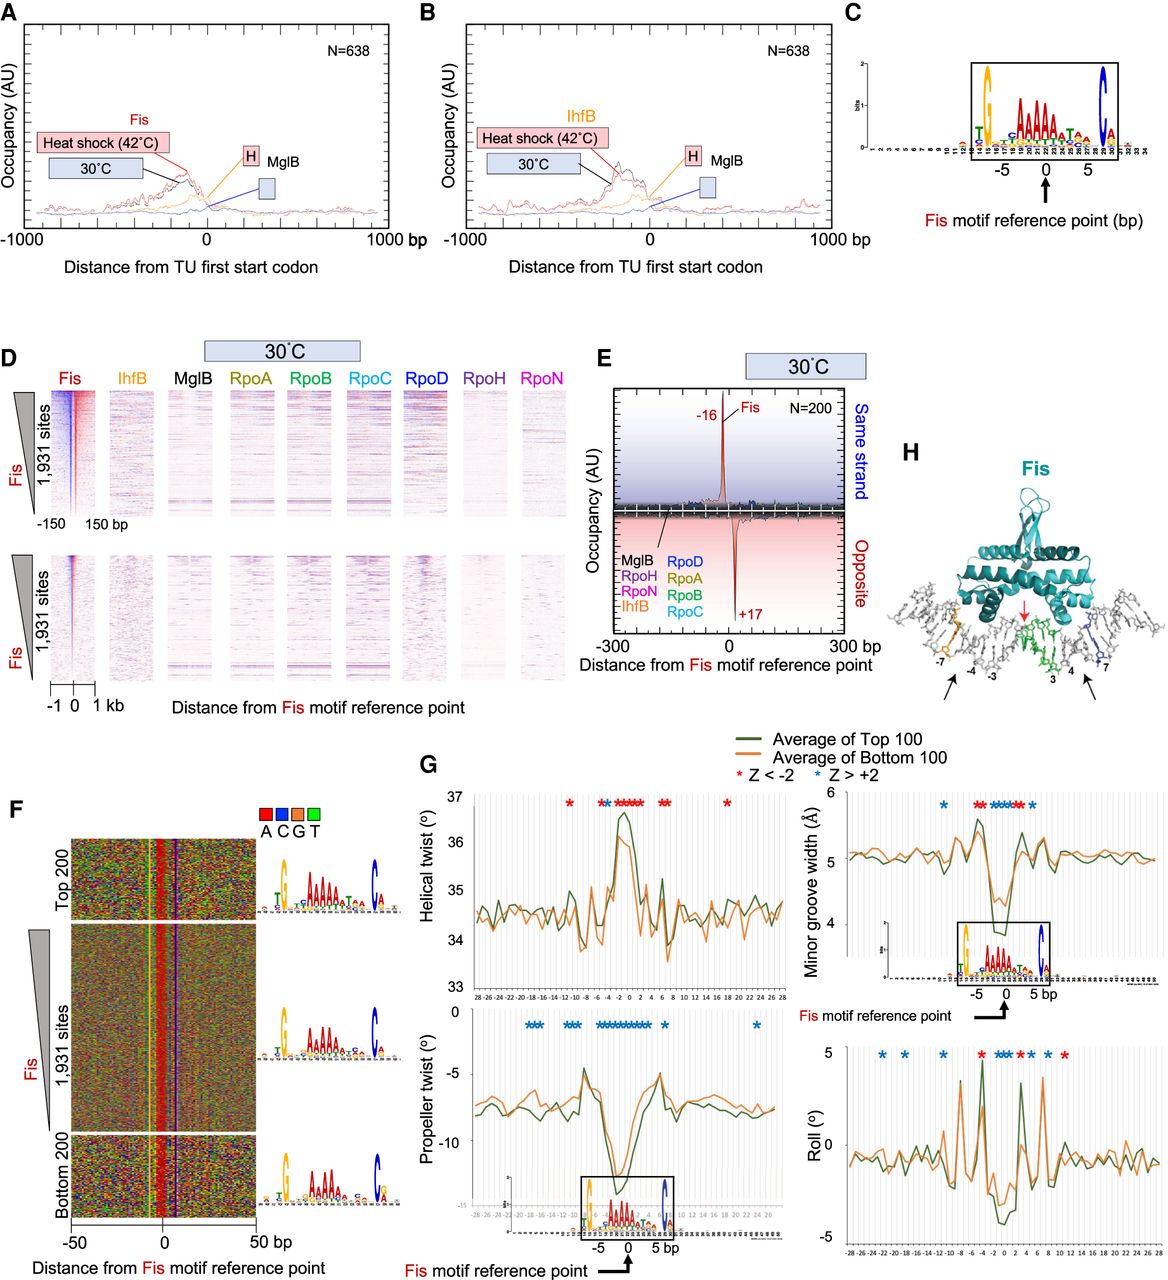
Genome-wide interactions of Fis. (A,B) Composite plots of Fis (A) or IHF (B) and MglB occupancy around the ATG start codons of 638 TUs. Plots also include heat shock data from Supplemental Figure S5. (C) MEME motif derived from the top 500 Fis-bound locations as described in Figure 2A. (D) Heatmap occupancy of indicated protein targets at 30°C distributed around the Fis motif reference point. For plotting details, see Figure 2B. (E–G) Distribution around Fis motifs of Fis and other target occupancies at 30°C (E), nucleotide sequence (F), and DNA shape (G). For plotting details, see Figure 2, D through F. (H) Crystal structure of Fis–DNA interactions (Stella et al. 2010). Black arrows indicate sites of contact. G and C nucleotides at −7 and +7 are colored (gold and blue, respectively), as is the poly(dA:dT) tract (green).


