
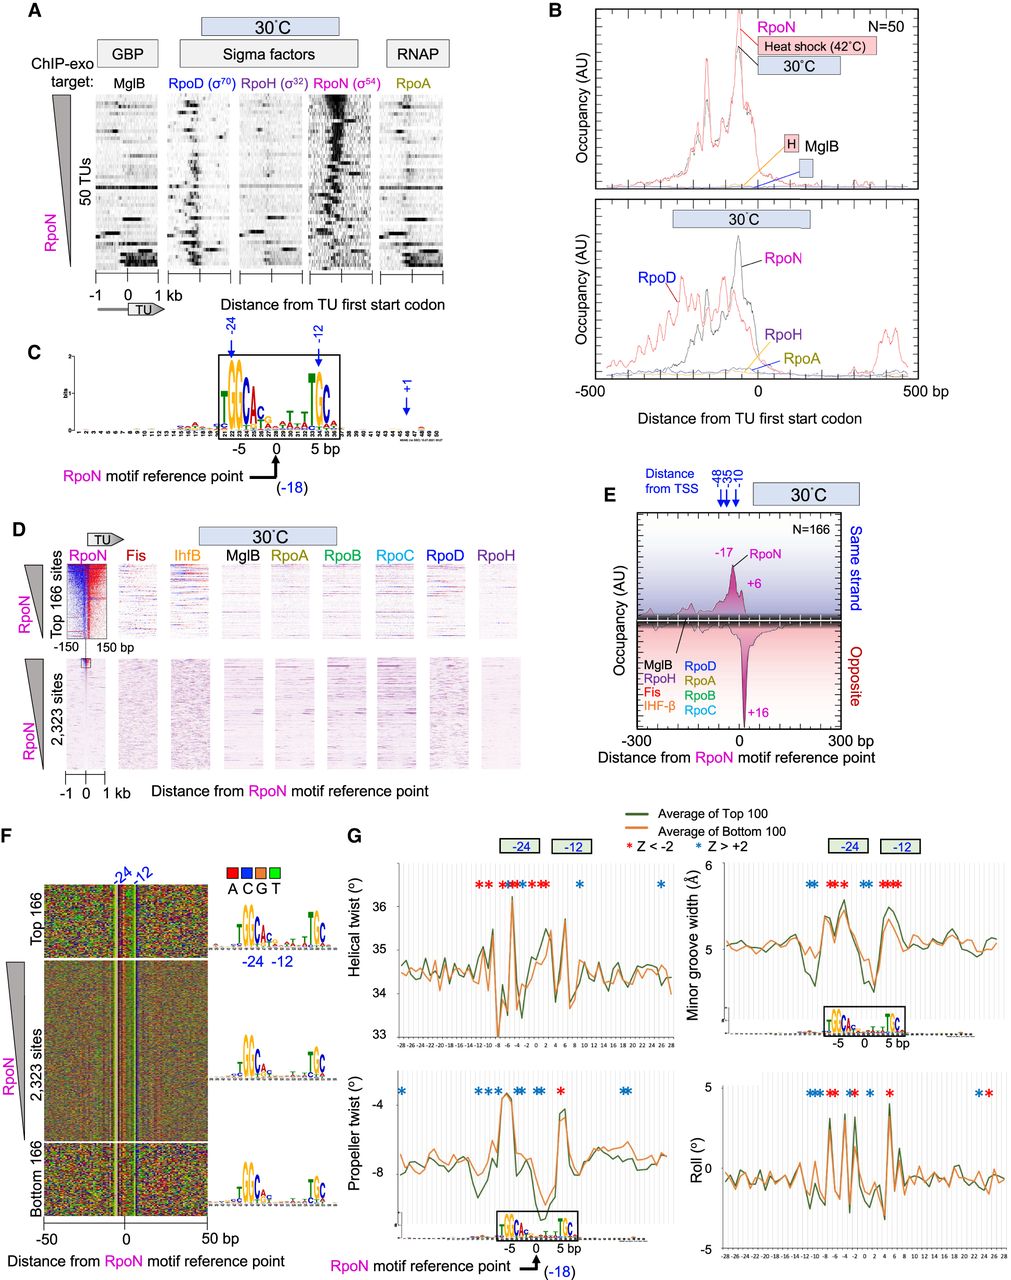
Genome-wide interactions of RpoN at RpoN promoters. (A) Distribution of RpoN around the ATG start codons of 50 RpoN-bound TU. Data are sorted based on RpoN occupancy ±500 bp from the ATG start of each gene. For additional figure details, see Figure 1A. (B) Composite plots of sigma factor, RpoA, and MglB occupancy at RpoN-bound TUs from panel A. Plots also include heat shock data from Supplemental Figure S4. For details, see Figure 1D. (C) MEME motif derived from the top 500 RpoN-bound locations as described in Figure 2A. (D) Heatmap occupancy of indicated protein targets at 30°C distributed around RpoN motif reference points. For plotting details, see Figure 2B. (E–G) Distribution around RpoN motifs of RpoN and other target occupancies at 30°C (E), nucleotide sequence (F), and DNA shape (G). For plotting details, see Figure 2, D through F.


