
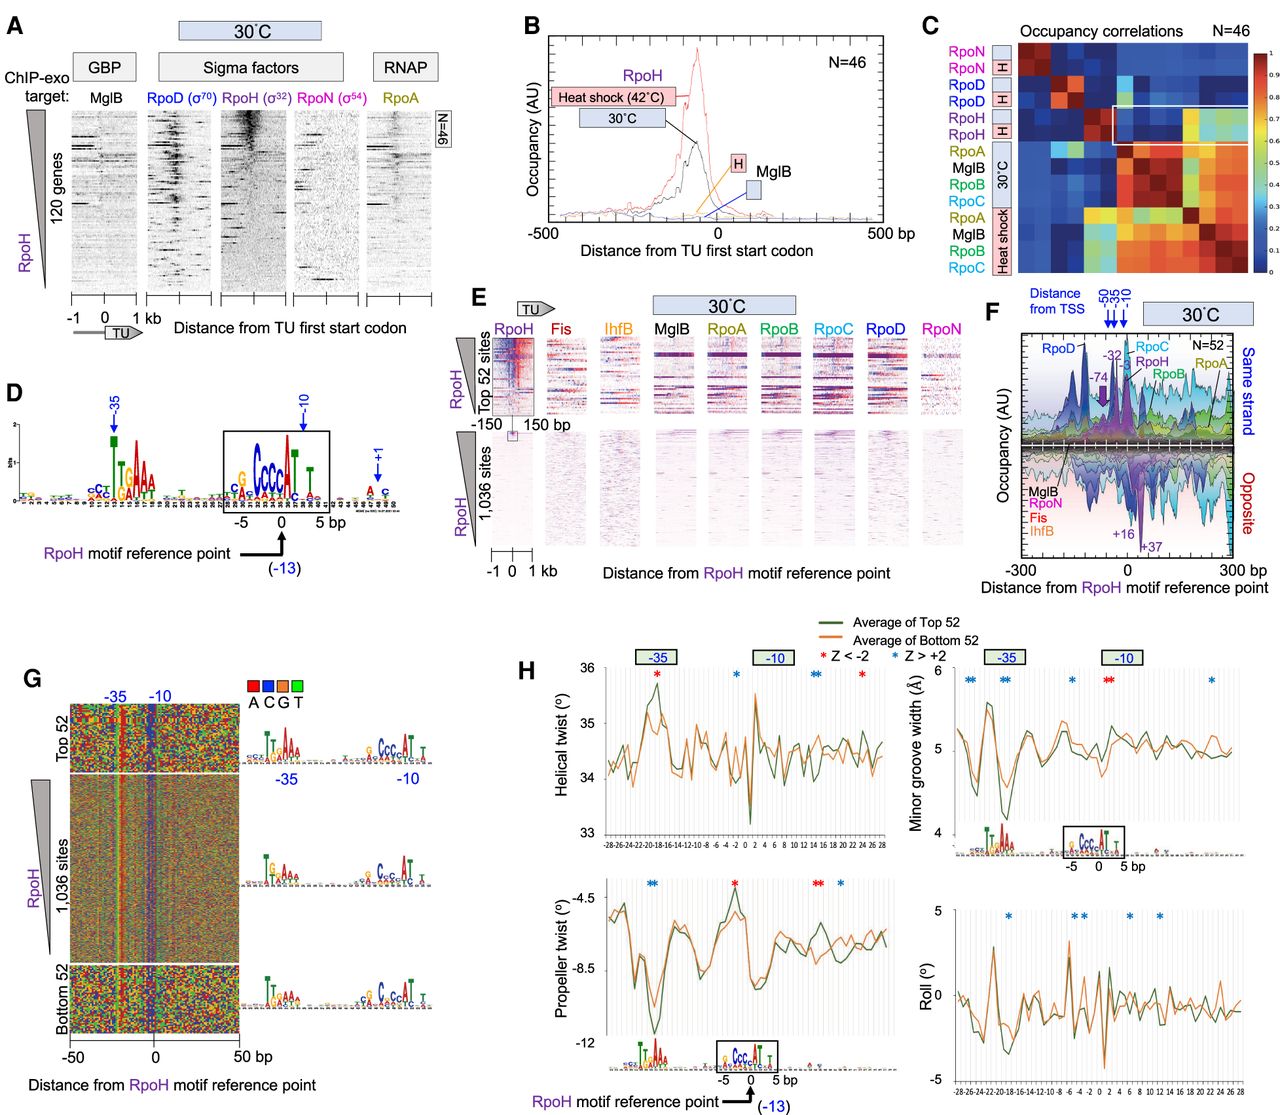
Genome-wide interactions of RpoH at RpoH promoters. (A) Heatmap of occupancy distribution of the indicated targets around TU ATG start codons of 120 previously defined heat shock genes (Nonaka et al. 2006; Gama-Castro et al. 2016). Data are sorted based on RpoH occupancy ±120 bp from the ATG start of each gene. The top 46 genes are indicated. For additional figure details, see Figure 1A. (B) Composite plots of RpoD and MglB occupancy of the top-most RpoH-bound TUs from panel A (N = 46). Plots also include heat shock data from Supplemental Figure S3. For details, see Figure 1D. (C) Heatmap matrix of correlation coefficients for target occupancy co-occurrence at 46 promoters (from −500 to +100 of a TU ATG start) defined in panel A. Heat shock, or H, denotes instantaneous change from 30°C to 42°C for 6 min. A white box is drawn around key correlation relationships. (D) MEME motif derived from the top 500 RpoH-occupied regions as described in Figure 2A. (E) Heatmap of occupancy for the indicated targets at 30°C distributed around the RpoH motif reference point. Data are sorted based on RpoH occupancy ±50 bp from the reference point. For additional plotting details, see Figure 2B. (F–H) Distribution around 52 RpoH motifs of RpoH and other target occupancies at 30°C (F), nucleotide sequence (G), and DNA shape (H). For plotting details, see Figure 2, D through F, for plotting details.


