
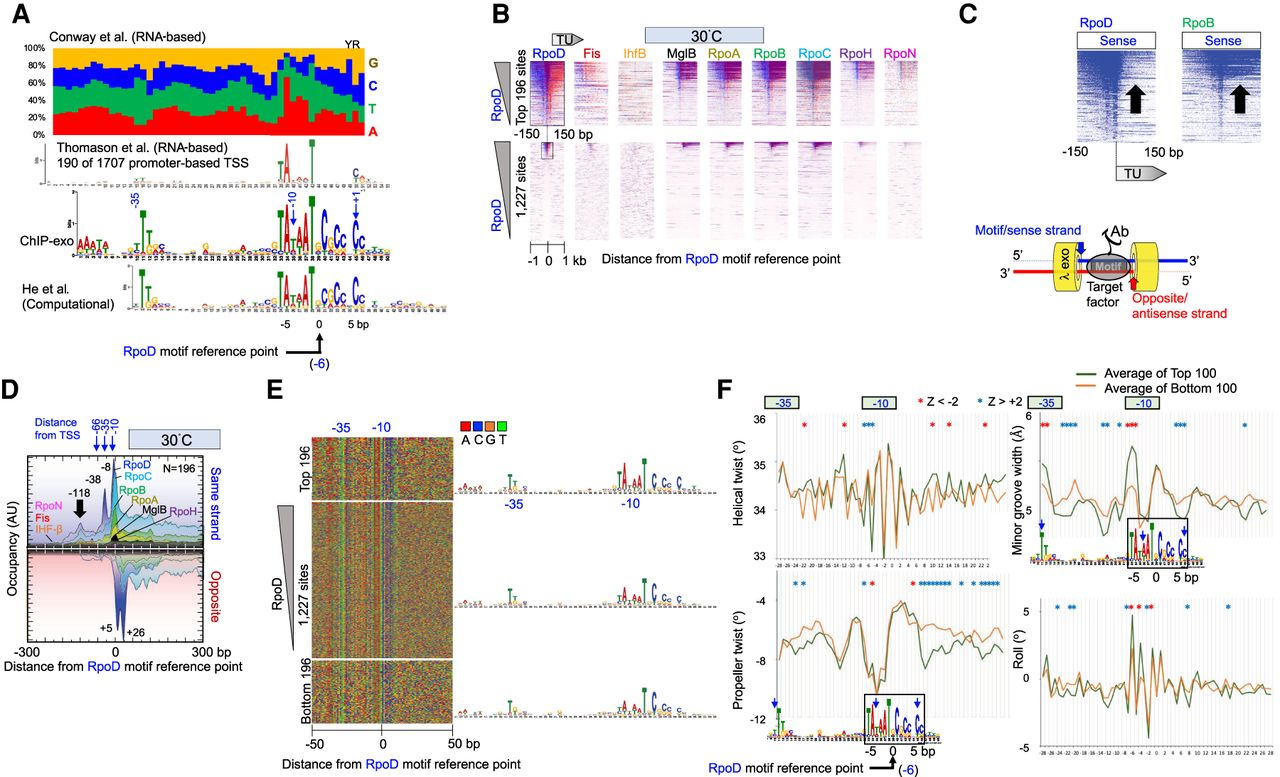
Properties of genome-wide RpoD–DNA interactions. (A) MEME motif of RpoD-bound locations. All panels are aligned to UP, −35, and −10 regions. Blue numbers refer to approximate base-pair distances from transcript start sites (Zuo and Steitz 2015). Negative values reflect distances in the 5′ direction on the sense/motif strand. Black numbers (−5, 0, 5) refer to base-pair distances from an arbitrary reference point within the motif (x = 0) and is the reference point used for all other panels in this figure. (Top) Nucleotide frequencies reported in Supplemental Table S3 of Conway et al. (2014). (First middle) MEME logo as reported in Supplemental Figure S7A of Thomason et al. (2015). (Second middle) MEME logo as defined by the top 500 RpoD-bound locations determined by ChIP-exo in this study. (Bottom) MEME logo as shown in Figure 2 of He et al. (2018). (B) Heatmap of occupancy distribution of the indicated protein targets as measured by ChIP-exo at 30°C. Rows correspond to RpoD motif instances (N = 1227; bottom panel) aligned by the reference point indicated in panel A. Blue indicates exonuclease stop sites on the sense/motif strand (sequence tag Read_1 5′ ends; see illustration at lower right); red reflects data on the antisense/opposite strand. Top panels show a zoom-in of the relevant section of the bottom panels. All data are sorted based on RpoD occupancy ±50 bp from the motif reference point. (C) Heatmaps from panel B, showing only the sense strand data from RpoD and RpoB. Arrows point out the TU region, in which there is an occupancy differential between RpoD and RpoB. (D) Composite plots of panel B (top), where the antisense/opposite strand data are inverted (N = 196). y-axis scales are linear, but with arbitrary units of occupancy (tag counts), and are thus not comparable between targets. Data files have an x-axis bin size of 2 bp and are smoothed with a 5-bp moving average. Peak locations are indicated. (E) Four-color plot of nucleotide sequences covering ±50 from the reference point in panel A. Corresponding MEME motifs are shown to the right. (F) Composite plots of DNA shape parameters in the vicinity of the RpoD motif reference point, comparing the top 100 RpoD-bound motifs (green) to the bottom 100 bound motifs (yellow). Positions exceeding a statistical Z-score threshold of two are indicated with asterisks.


