
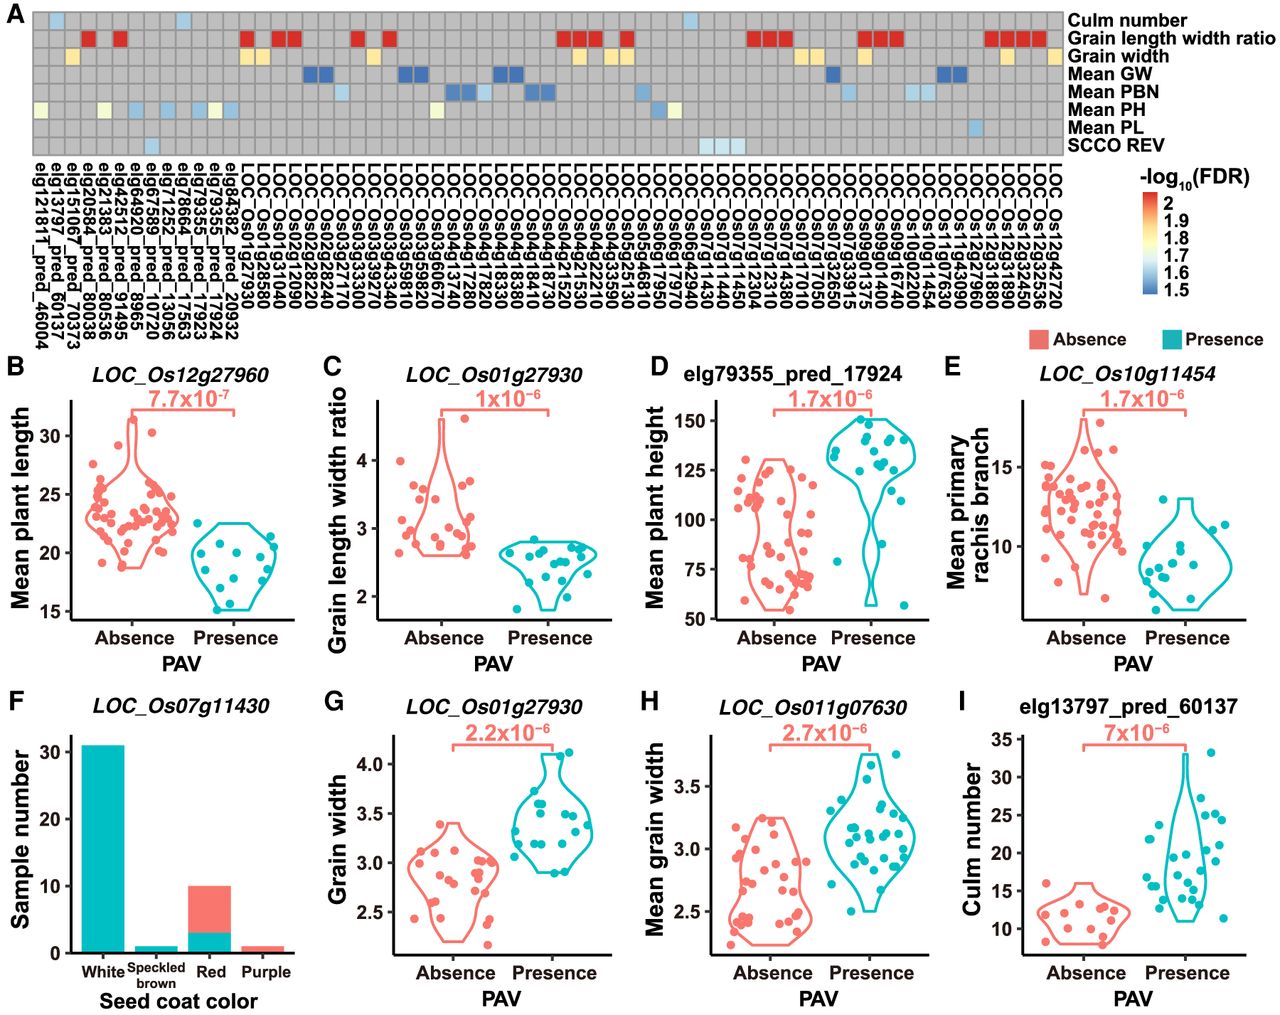
The associations between phenotypes and gene PAVs. (A) The association heat map of gene PAVs and phenotypes (only associations with P < 1 × 10⁻⁵ and FDR < 5 × 10⁻² are displayed). (Mean GW) mean grain width, (Mean PBN) mean primary rachis branch, (Mean PH) mean plant height, (Mean PL) mean plant length, and (SCCO REV) seed coat color. The phenotypes started with “mean” are measured in this research. (B–I) Some examples of gene PAVs significantly associated with phenotypes: (B) Mean plant length and LOC_Os12g27960 (P = 7.7 × 10⁻⁷, FDR = 2.5 × 10⁻²); (C) Grain length width ratio and LOC_Os01g27930 (P = 1.0 × 10⁻⁶, FDR = 8.2 × 10⁻³); (D) Mean plant height and a predicted gene elg79355_pred_17924 (P = 1.7 × 10⁻⁶, FDR = 1.7 × 10⁻²); (E) Mean primary rachis branch and LOC_Os10g11454 (P = 1.7 × 10⁻⁶, FDR = 2.3 × 10⁻²); (F) Seed coat color and LOC_Os07g11430 (P = 2 × 10⁻⁶, FDR = 2.1 × 10⁻²); (G) Grain width and LOC_Os01g27930 (P = 2.2 × 10⁻⁶, FDR = 1.3 × 10⁻²); (H) Mean grain width and LOC_Os11g07630 (P = 2.7 × 10⁻⁶, FDR = 3.2 × 10⁻²); (I) Culm number and a predicted gene elg13797_pred_60137 (P = 7.0 × 10⁻⁶, FDR = 2.3 × 10⁻²).


