
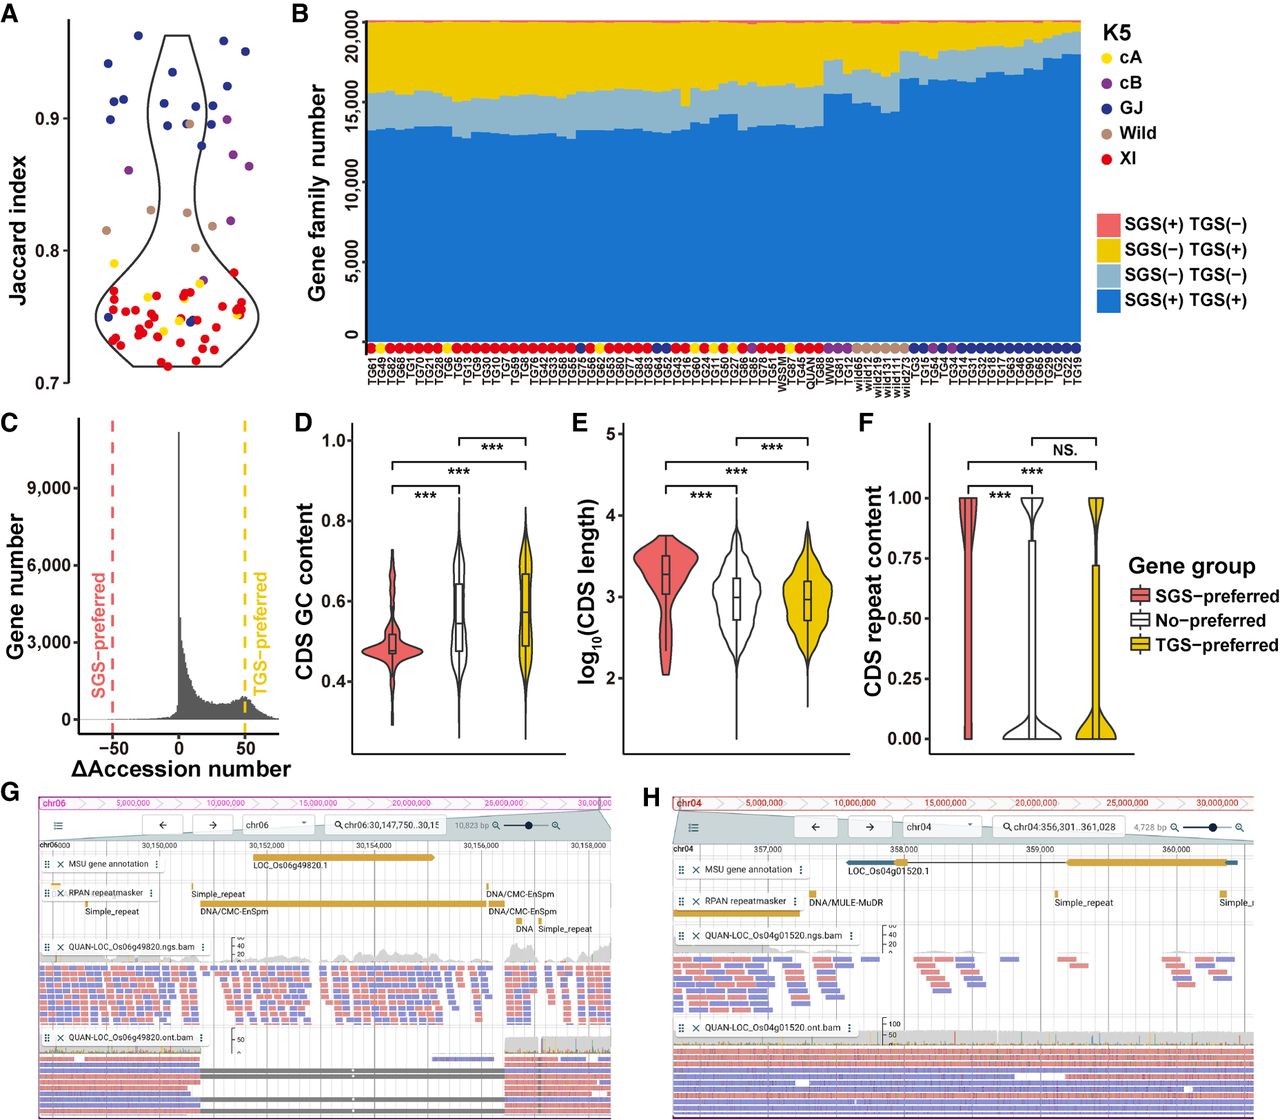
Comparison of gene family PAVs derived from the SGS and TGS data. (A) Jaccard Indices of gene family PAVs derived from SGS and TGS. (B) The number of gene families in each rice accession detected from SGS or TGS. In most rice accessions, especially in population XI, many more gene families were detected from the TGS data than the SGS data. (C) The number of genes versus their ΔAccession numbers. For each gene, its ΔAccession number = number of accessions with this gene detected by TGS − number of accessions with this gene detected by SGS; >50: TGS-preferred genes (n = 9321); <−50: SGS-preferred genes (114); and −50 ∼ 50: No-preferred genes (65,870). (D–F) CDS feature comparison for genes preferred by SGS or TGS. (D) GC contents, (E) lengths, (F) repeat contents. A two-sided Wilcoxon rank-sum test was used to measure the significance of differences. (***) P < 0.001. (G) The read alignment of gene LOC_Os06g49820 in rice accession QUAN indicates that a deletion near this gene is ignored from SGS. (H) The read alignment of another gene LOC_Os04g01520 indicates insufficient reads from SGS are mapped to this gene region, whereas reads from TGS cover it.


