
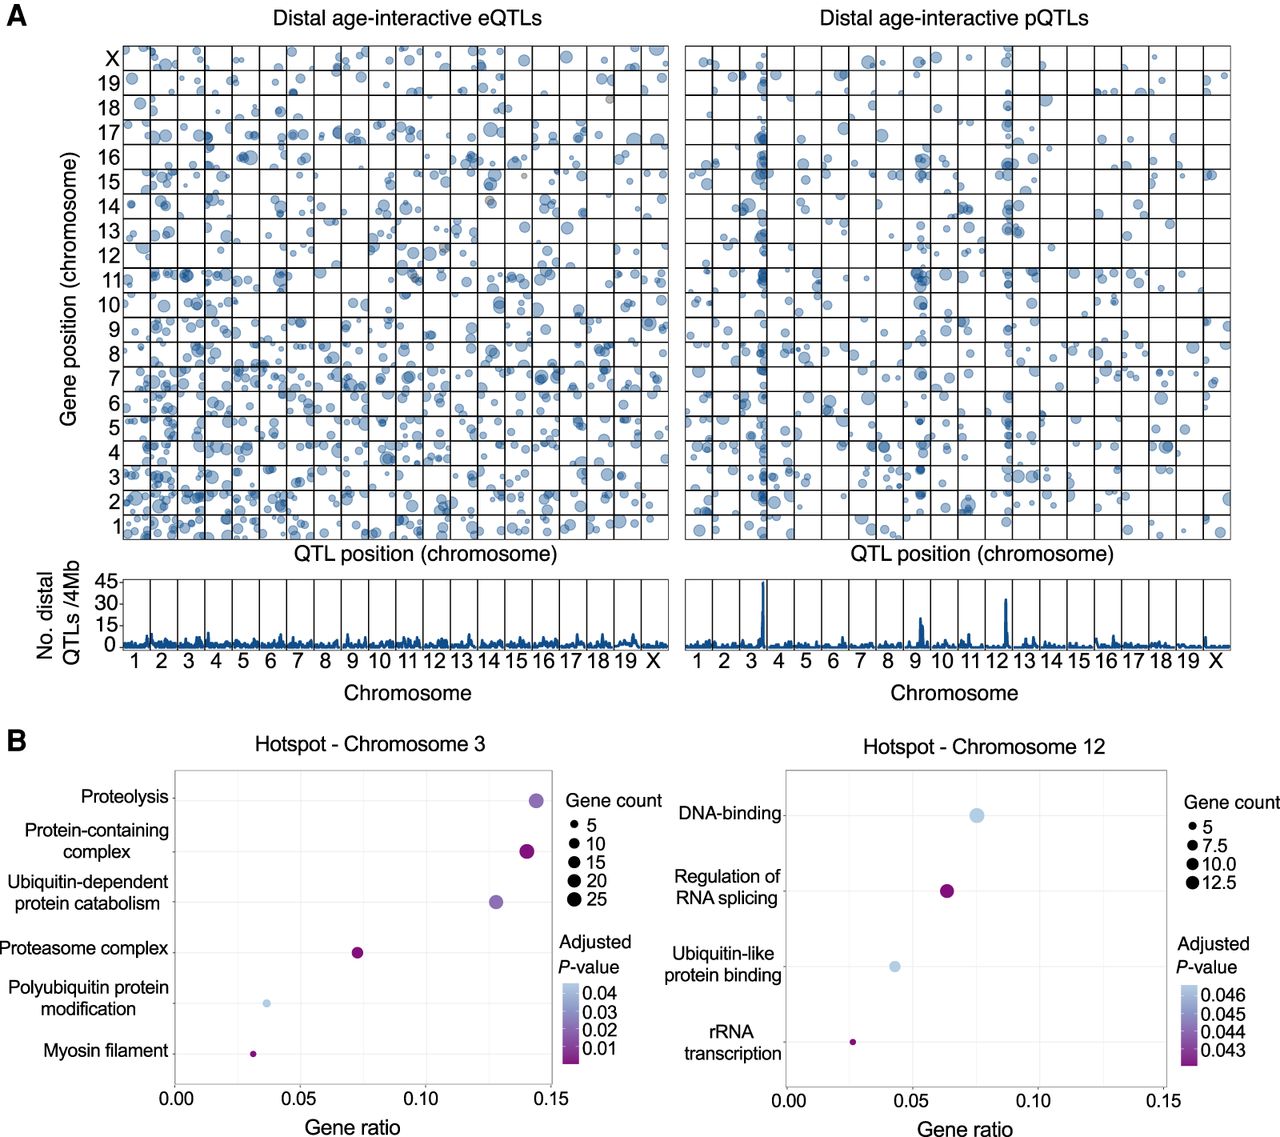
Genetic mapping reveals genomic hotspots of age-interactive QTL. (A) Age-interactive QTL (age-QTL) were identified by testing for an age-by-genotype interaction effect and are plotted for transcripts (age-eQTL, left) and protein (age-pQTL, right). Significant age-QTL (genome-wide error rate < 0.05) are plotted (top) based on the location of their peak association (x-axis) and the position of the coding gene (y-axis). Point size is proportional to LOD score. The lower panels show the density of distal age-QTL detected at positions spanning the genome based on 4-Mb windows. Two hotspots for distal age-pQTLs were identified on Chromosomes 3 and 12. (B) Functional enrichment results for proteins that map age-pQTL to the hotspots on Chromosome 3 (left) and Chromosome 12 (right). Enrichment categories are plotted by with their gene ratio—the number of genes in hotspot-defined sets in category divided by the number of all the genes in the category—with point size indicating the number of genes and point color indicating the adjusted P-value.


