
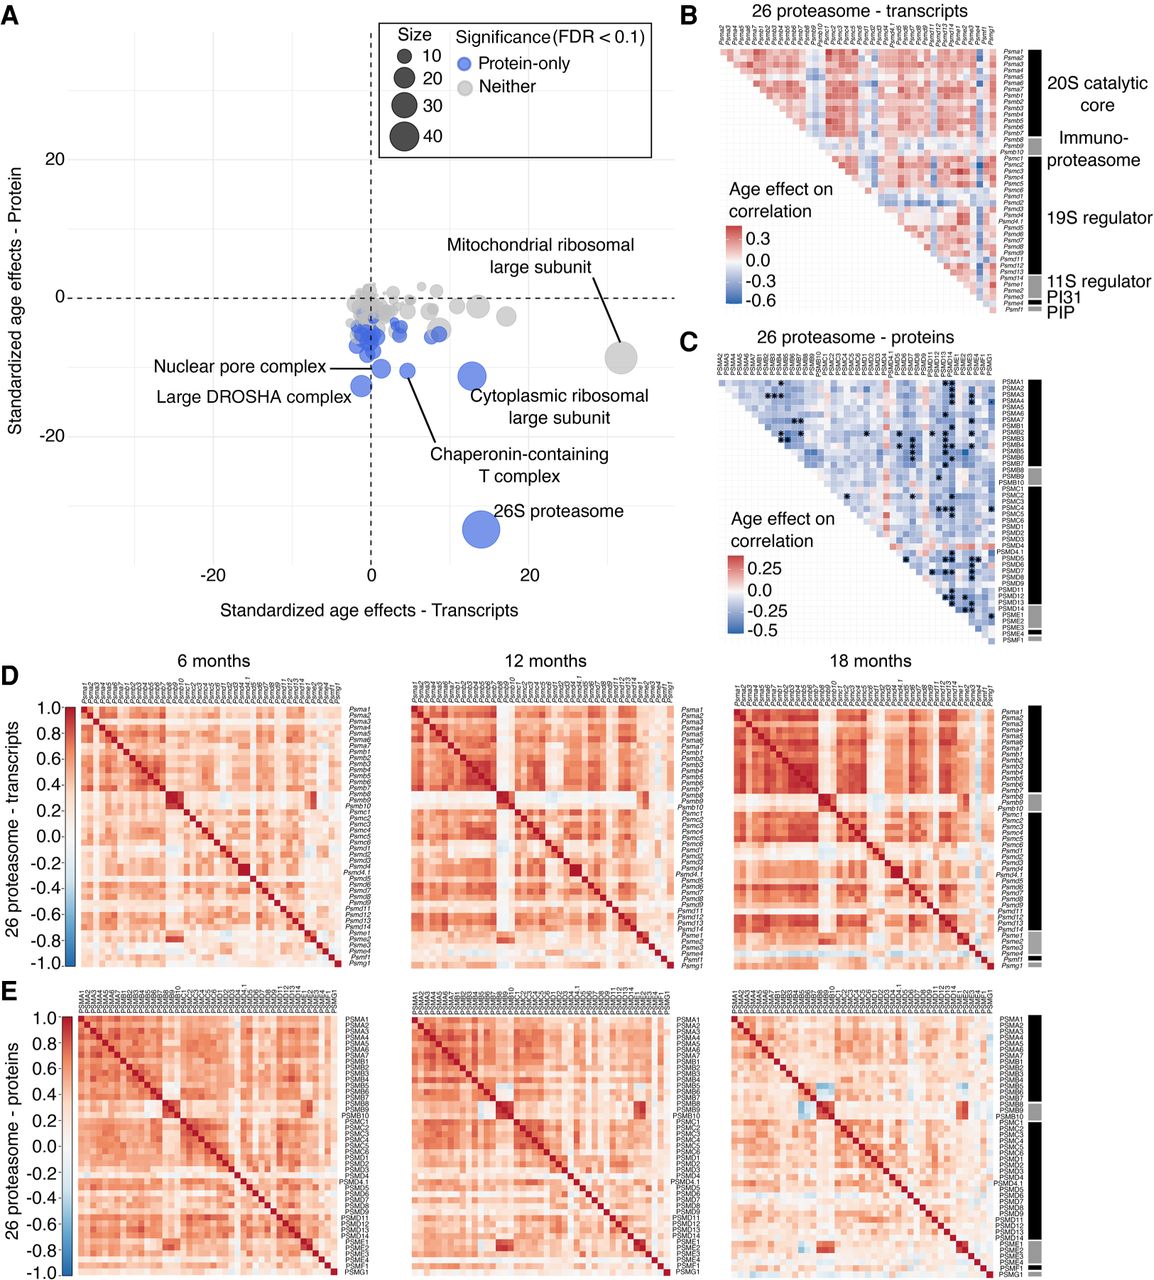
Correlations between protein complex members change with age. (A) Standardized age effects on correlation for 123 protein complexes are shown for transcripts (x-axis) and proteins (y-axis). Point size represents the number of proteins observed for each complex. Blue points represent protein complexes with a significant age effect (FDR < 0.1) for proteins. Gray points represent protein complexes without a significant age effect for transcript or protein. Age effects are estimated by linear regression and reported as change in the correlation coefficient per year. Horizontal and vertical lines at 0 included for reference. Heatmaps represent the age-related change in correlations between gene pair members of the 26S proteasome complex for protein abundance (B) and transcript expression (C). Dots indicate significant pairwise changes in correlations with age (FDR < 0.1). Black and gray bars on the y-axis indicate subcomplexes of the 26S proteasome. Heatmaps represent the Pearson's correlation matrices for 26S proteasome complex for transcripts (D) and for proteins (E) at 6 mo, 12 mo, and 18 mo (left to right).


