
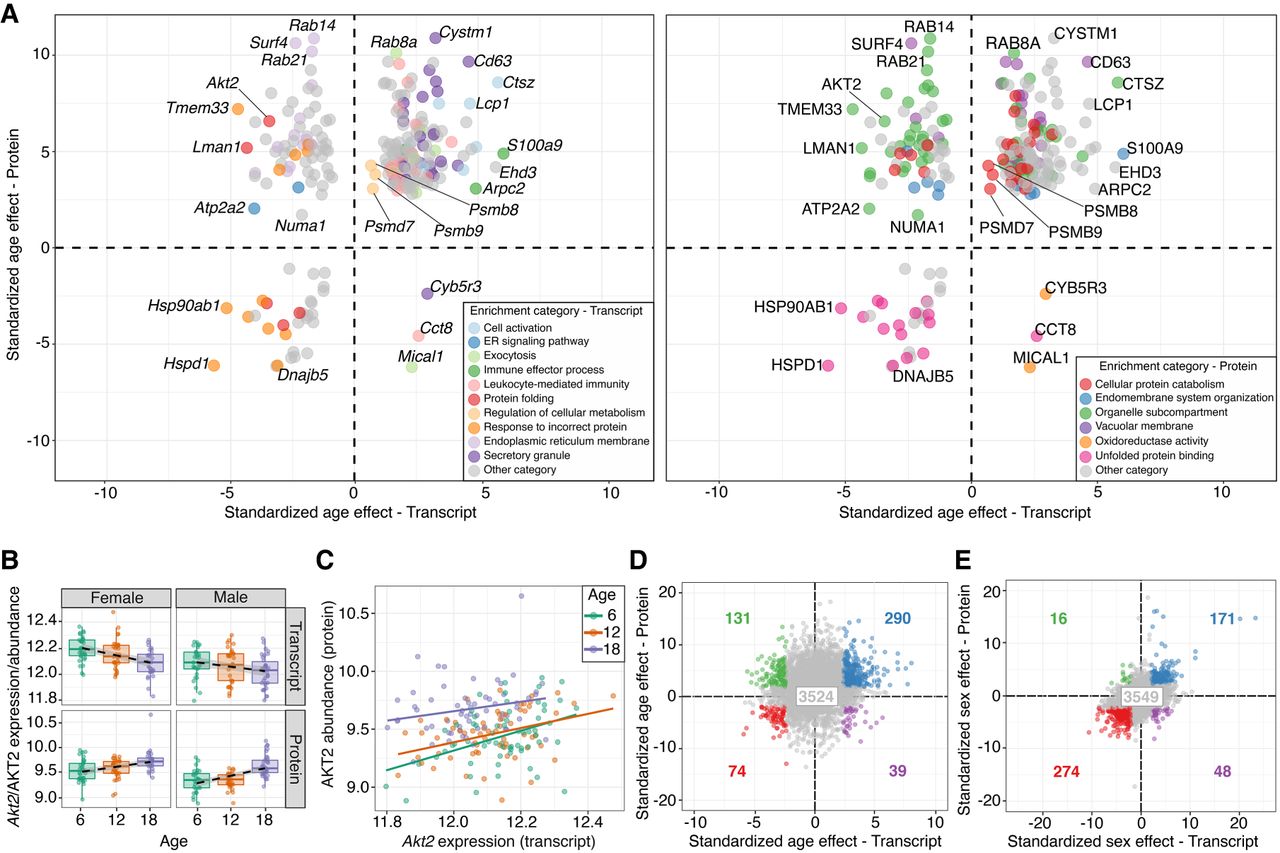
Comparisons of age effects on transcripts and proteins reveal similarities and differences. (A) Standardized age effects for transcripts (x-axis) and proteins (y-axis) with genes highlighted based on enrichment analysis results from the transcriptome (left) and proteome (right). Colored points represent enrichment categories of genes based on enrichment sets defined by transcripts (left) and by proteins (right). Gray points represent genes that were not annotated to one of the highlighted sets. Horizontal and vertical lines at 0 included for reference. (B) Change in transcript (top) and protein (bottom) abundance (y-axis) of the gene Akt2 with age (x-axis), stratified by sex (with females on left and males on right). Best fit lines included to emphasize trends. (C) Protein abundance by transcript expression for the gene Akt2. Points are colored based on age group. Best fit lines for each age group included to illustrate correlation. (D) Standardized age effects for all the proteins (y-axis) plotted against the effect for their corresponding transcripts (x-axis). Blue points represent genes that have concordant increases with age for both transcripts and proteins. Green points represent genes that have discordant decreases with age for transcripts but increases for proteins. Purple points represent genes that have discordant increases with age for transcripts but decreases for proteins. Red points represent genes that have concordant decreases with age for both transcripts and proteins. Gray points represent genes that do not have a significant age effect (FDR > 0.1) for both transcript and protein. The number in each quadrant corresponds to the number of total genes in each group. Horizontal and vertical lines at 0 included for reference. (E) Standardized sex effects for all the proteins (y-axis) plotted against the effect for their corresponding transcripts (x-axis). Points colored as in D with the corresponding number of total genes in each group.


