
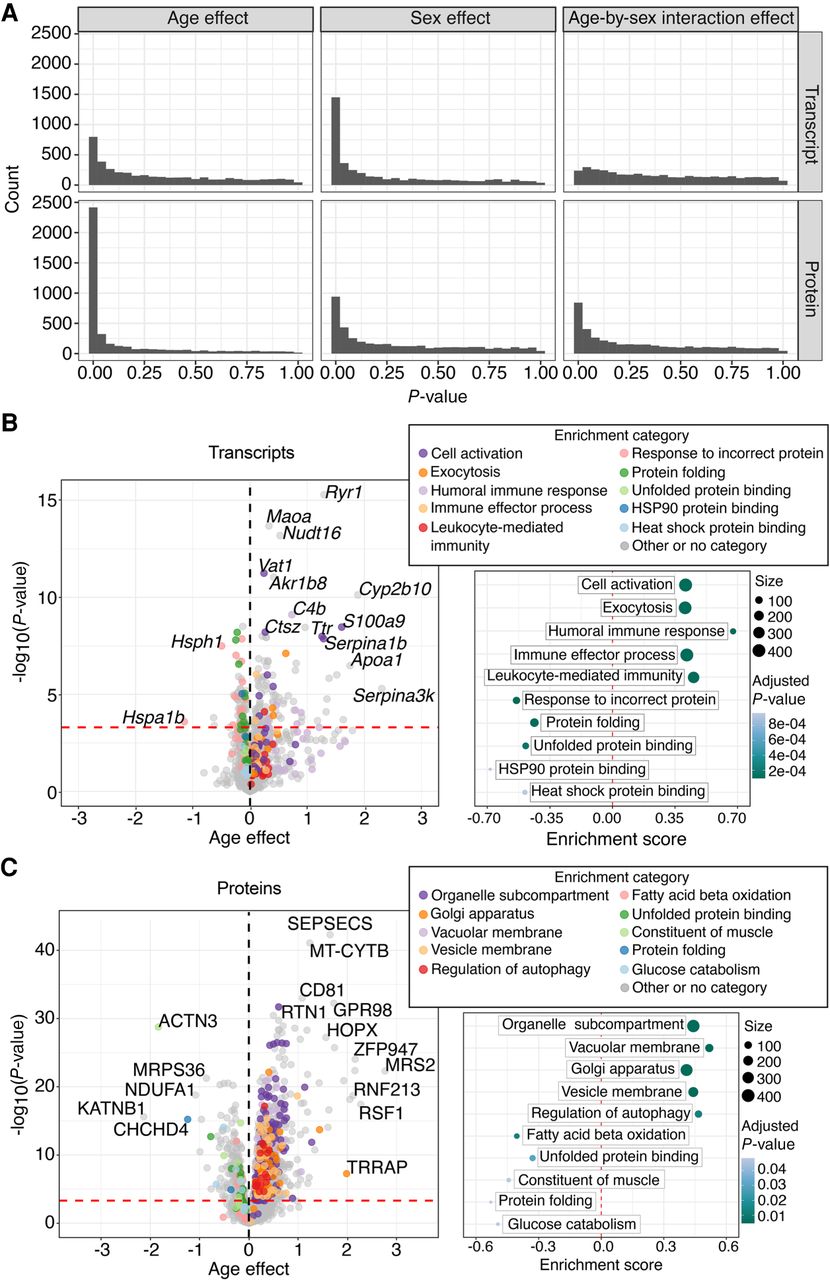
Age-related changes in transcripts and proteins. (A) Distribution of P-values for tests of (left to right) age, sex, and age-by-sex interaction effects for transcripts (top) and proteins (bottom). Volcano plots show the age effects (x-axis) and the −log10(P-values) (y-axis) of all the transcripts (B, left) and all the proteins (C, left) in the common set. Horizontal red line indicates the significance cutoff of FDR < 0.01. Vertical black line is at 0 and included for reference. Age effects are reported as log2 fold change in abundance per year. The colored points on the volcano plots represent the five most significant (FDR < 0.05) up-regulated enrichment categories and the five most significant down-regulated categories from the gene-set enrichment analysis. Gray points represent transcripts or proteins that were not annotated to the highlighted categories. Top enrichment categories are shown in B (right) and C (right), with the enrichment score plotted on the x-axis and category on the y-axis, point color indicates the adjusted P-value, and point size indicates the size of the category. Vertical red line at 0 is included for reference.


