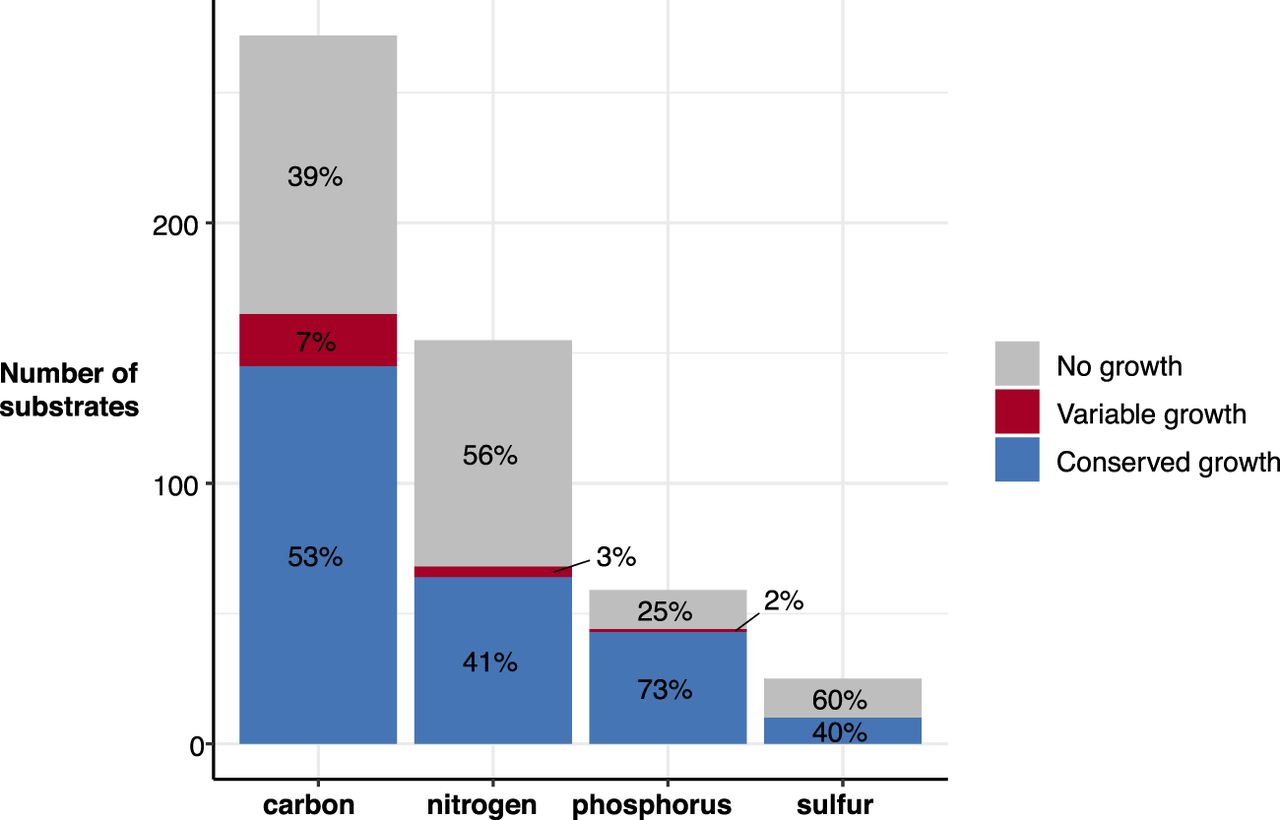
A curated collection of Klebsiella metabolic models reveals variable substrate usage and gene essentiality

(Downloading may take up to 30 seconds. If the slide opens in your browser, select File -> Save As to save it.)

Click on image to view larger version.

Figure 2.
Figure 2.

Predicted substrate utilization by type. Bar height indicates number of substrates for each type, with segments colored to indicate those associated with no growth for any strain (gray), variable growth (red), and conserved growth (blue). Percentages are indicated within each segment.

This Article

  1. Genome Res. 32: 1004-1014

Preprint Server