
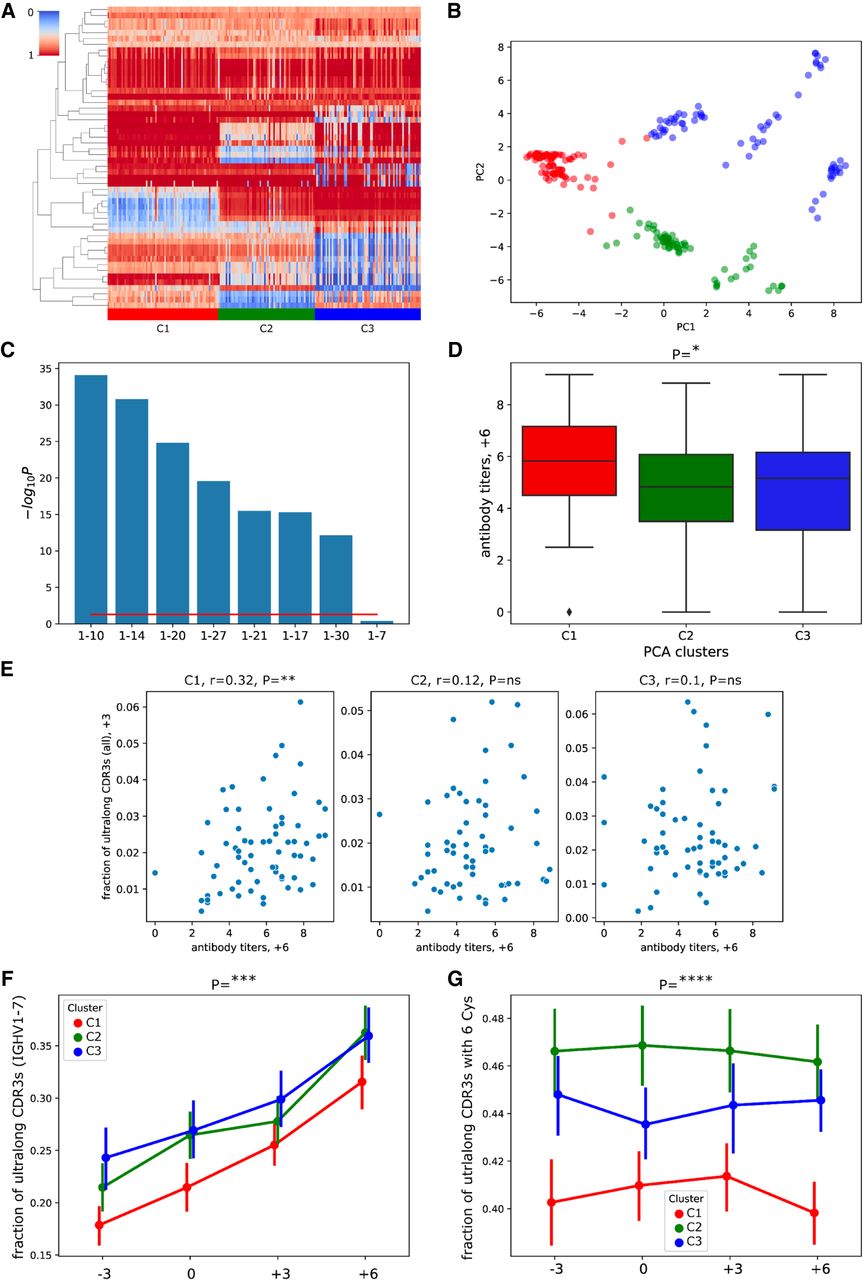
GSVs of V genes are associated with gene usages and antibody titers. (A) The 52 × 204 IGenotype matrix for 52 GSVs of V genes across 204 calves. Rows represent GSVs, columns represent animals. Rows are ordered using the hierarchical clustering, and columns are ordered according to the three clusters found using PCA, followed by k-means clustering. Three clusters C1, C2, and C3 are shown in red, green, and blue in the lower horizontal panel, respectively. The order of animals within a cluster is chosen arbitrarily. R-ratios vary from 0 (blue) to 1 (red). (B) Principal components 1 and 2 of the IGenotype matrix shown in A. Three identified clusters are shown in red, green, and blue. (C) Likelihoods of association P-values between three PCA clusters and usages of V genes. Usages are computed in the combined data sets. Likelihood is computed as the negative logarithm of the P-value to the base of 10. Genes are shown in the descending order of likelihoods. The red line corresponds to P = 0.05. (D) Antibody titers at time point “+6” for three PCA clusters. (E) Antibody titers at time point “+6” versus fractions of ultralong CDR3s in all CDR3s at time point “+3” across clusters C1–C3. The Pearson's correlations (r) and P-values (P) are shown at the top of the panel. (F) Fractions of ultralong CDR3s among all CDR3s derived from IGHV1-7 in clusters C1, C2, and C3 at four time points. (G) Fractions of ultralong CDR3s with six cysteines among all ultralong CDR3s in clusters C1, C2, and C3 at four time points. Vertical lines in F and G show 95% confidence intervals.


