
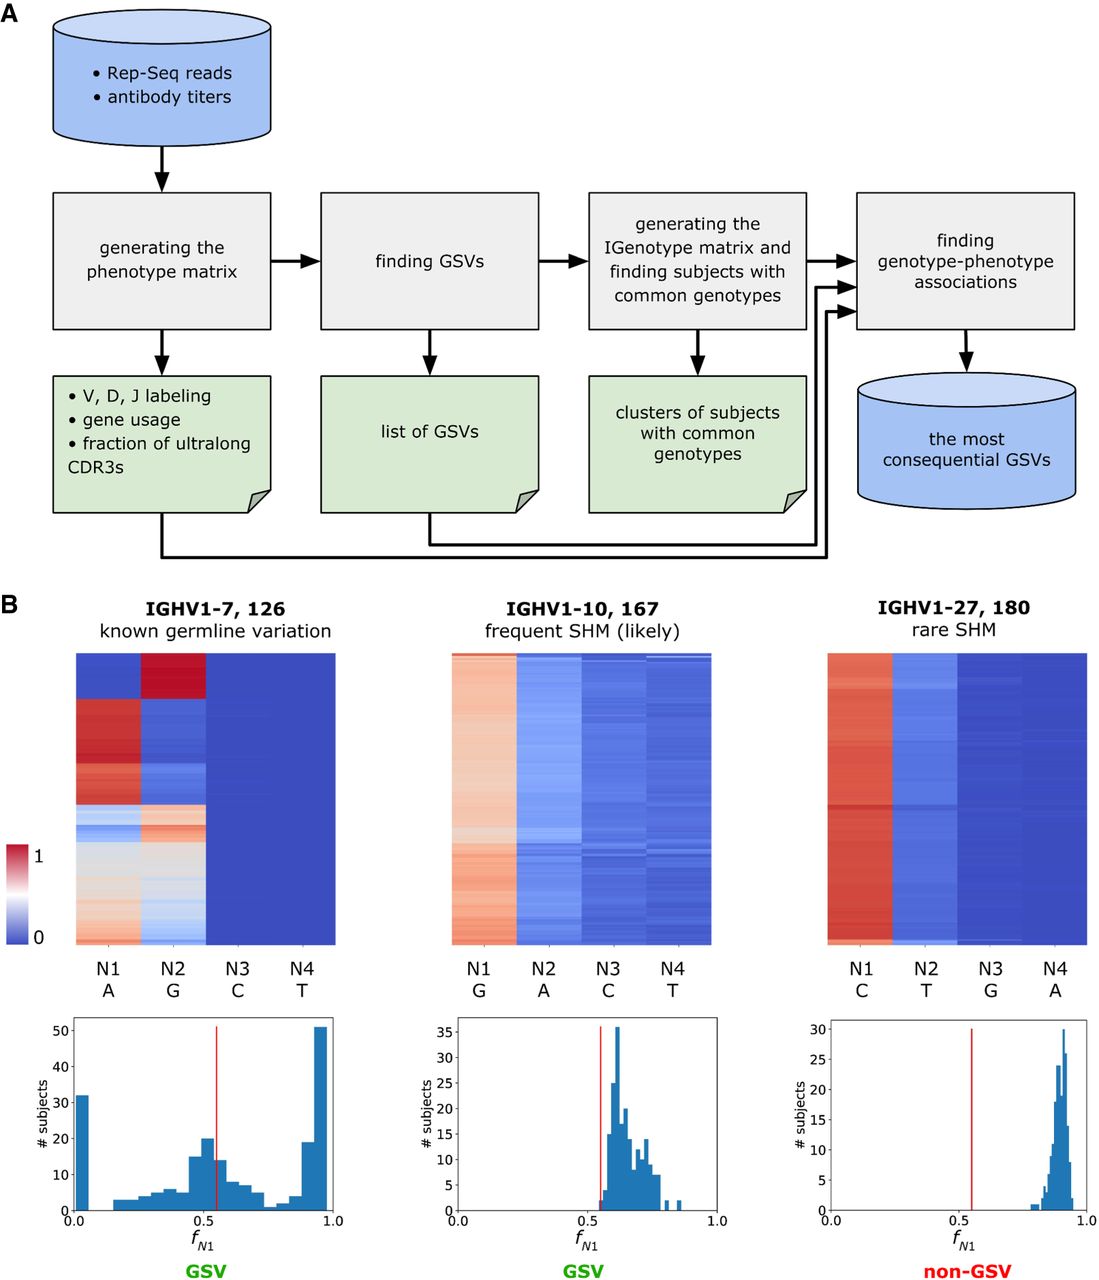
Overview of IgQTL method. (A) The IgQTL pipeline. Gray rectangles show various steps of the IgQTL pipeline. The input (Rep-Seq reads and antibody titers) and the final output (the most consequential GSVs) are shown in blue. Intermediate output is shown in green. (B) The procedure for finding GSVs (126, IGHV1-7, A/G) and (167, IGHV1-10, G/A), as well as non-GSVs (180, IGHV1-27, C/T). Heat maps in the upper row show the fractions of the nucleotides across all subjects varying from 0 (blue) to 1 (red). Columns are arranged according to the sum of fractions across all subjects. N1 and N2 correspond to the first and the second columns, respectively. Histograms in the lower row show distributions of fractions fN1 across 204 animals. The red vertical line in each histogram corresponds to freq = 0.55.


