
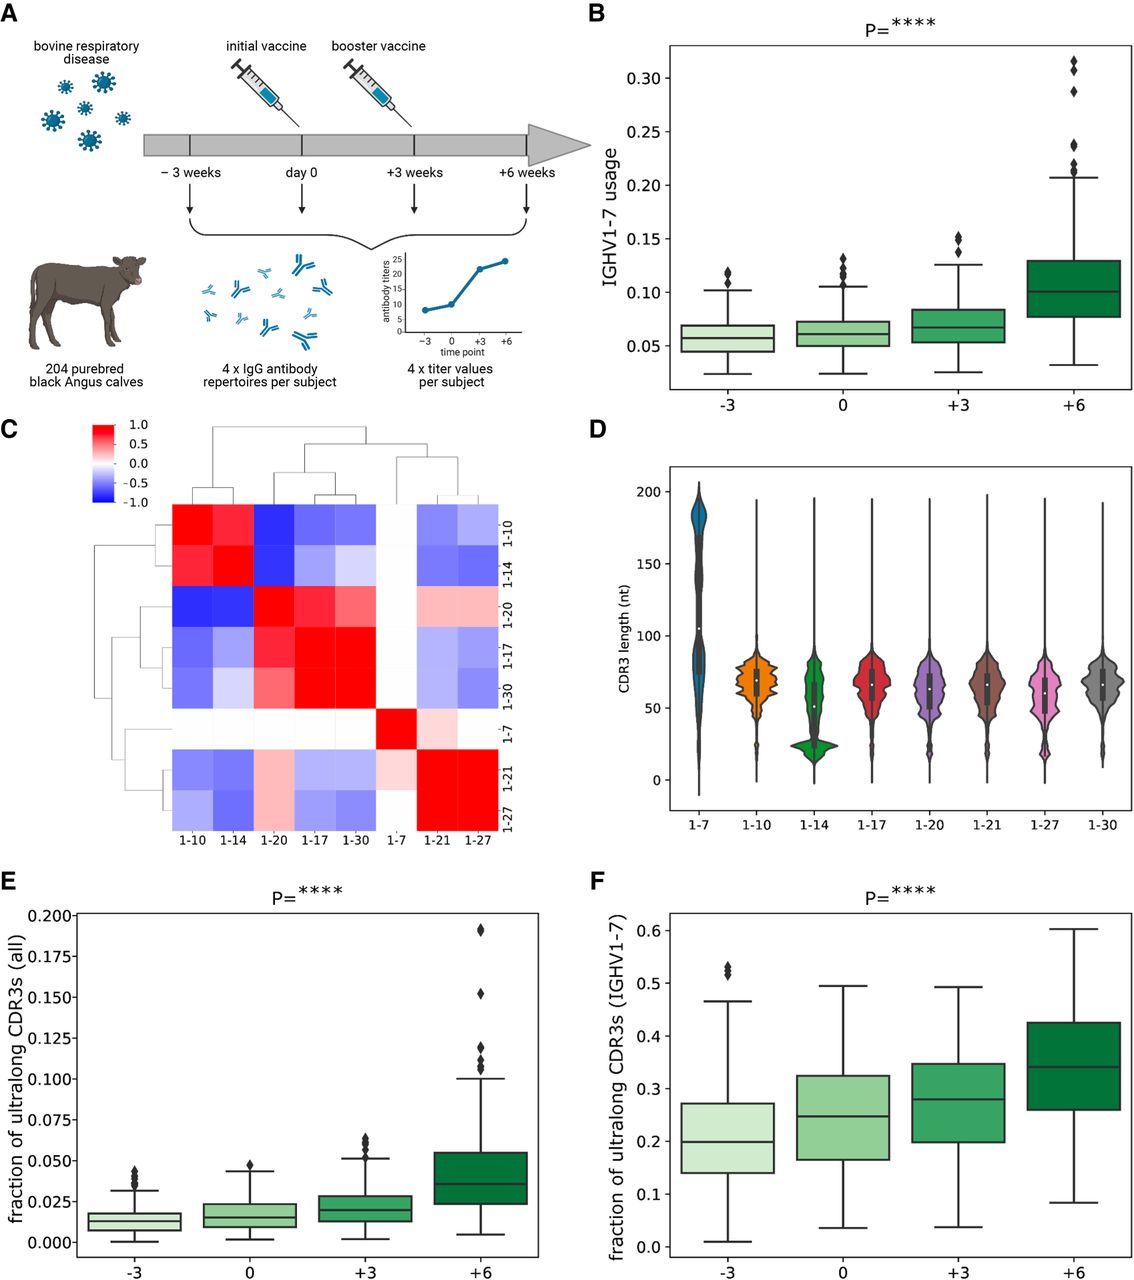
Overview of study design and characteristics of antibody repertoires. (A) An overview of the study design. Two hundred four calves were vaccinated against BRD, and their expressed antibody repertoires were sequenced at four time points pre- and postvaccination. Serum from each of the sequenced animals was also assayed for BRD-specific antibody titers at the same time points. (B) The distribution of IGHV1-7 usage at four time points. Here (and further), each box shows the quartiles of the distribution. The whiskers show the rest of the distribution, except for outliers found using a function of the interquartile range implemented by the Seaborn package in Python. P-values have the following notations: (ns) ≥ 0.05, (*) P < 0.05, (**) P < 0.01, (***) P < 0.001, (****) P < 0.0001. (C) The matrix shows the Pearson's correlations between gene usages computed across all high-usage V genes at time point “−3.” Correlation values vary from −1 (blue) to 1 (red). Statistically insignificant correlations (P ≥ 0.05) are shown as white cells. (D) The histogram of the distributions of the CDR3 lengths for eight highly used cattle V genes. The histogram is computed for individual 14,007. (E) The distribution of the fraction of ultralong CDR3s in all CDR3s at four time points. (F) The distribution of the fraction of ultralong CDR3s in CDR3s derived from IGHV1-7 at four time points.


