
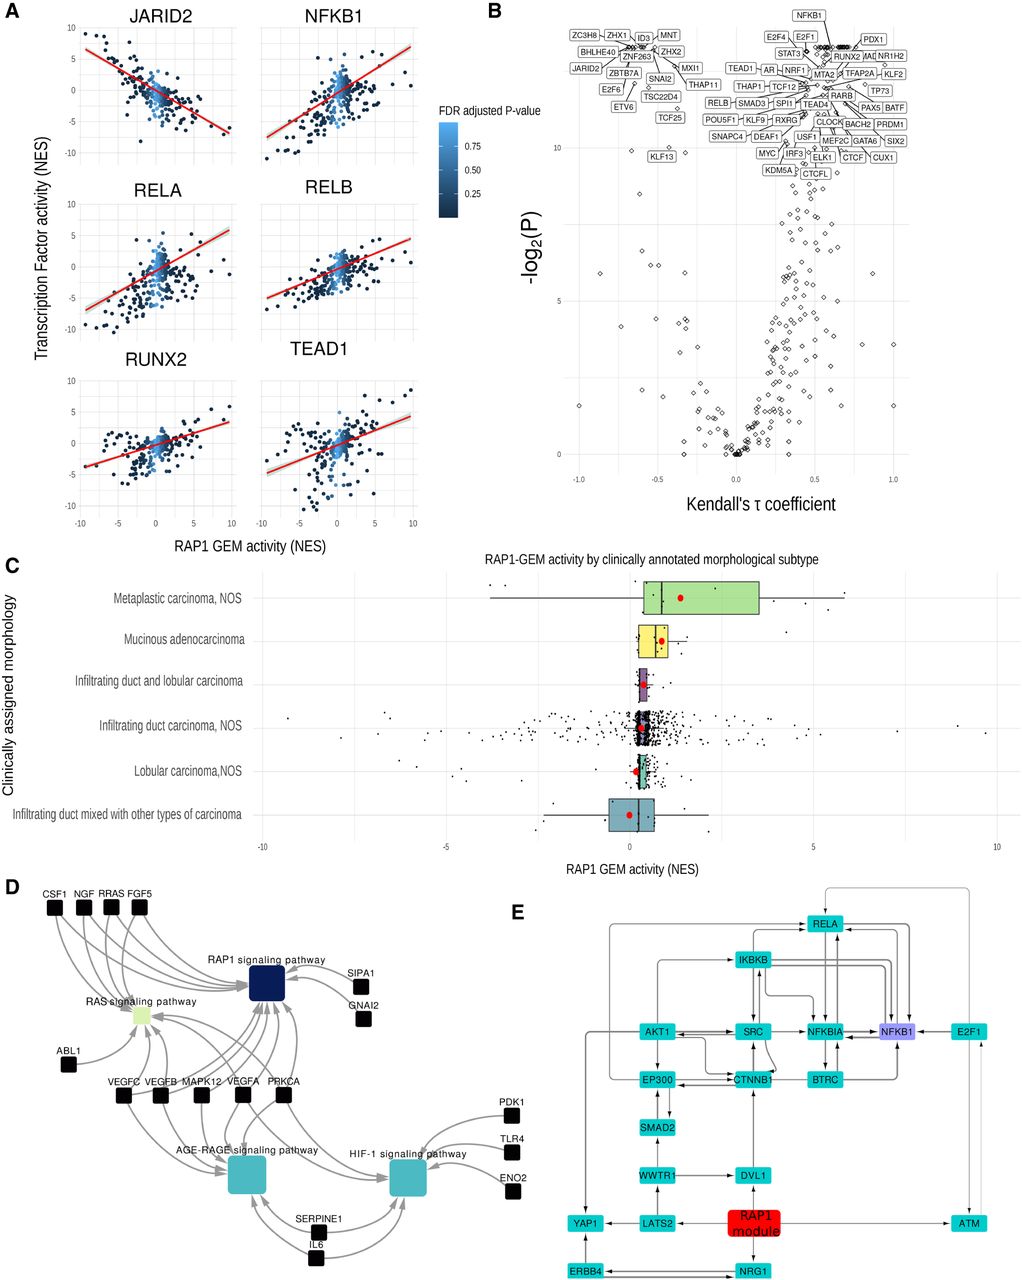
Expression of RAP1 gene expression module in further breast cancer cell lines and in clinical samples. (A) Plots showing the correlation between the RAP1 gene expression module activity (normalized enrichment score) (see Methods) and the activity (NES) of various TF (JARID2, NF-kB1, RELA, RELB, RUNX2, and TEAD1). The line of best fit according to linear regression is shown in red, with the confidence interval in gray. Color of the points in the plot represents the FDR adjusted P-value of the RAP1 NES as calculated by DOROTHEA. (B) Volcano plot illustrating the correlation (Kendall's rank correlation) between activity of RAP1 gene expression module and TF activity, with Kendall's tau coefficient along the x-axis and -log2(FDR adjusted P) along the y-axis. (C) Bar plot showing RAP1-GEM activity across different breast cancer samples, separated by clinically assigned morphology. The y-axis shows RAP1 gene expression module activity as calculated by DOROTHEA in NES. Mean values for each group are shown by a red dot. (D) Network showing gene set enrichments of the contents of RAP1 gene expression module. Genes are shown in pale blue, and pathways are shown by nodes whose color indicates significance of the associated term [−log2(P)]. (E) Subnetwork showing the top flow-carrying edges (99th percentile) calculated using the maximum-flow algorithm between RAP1 gene expression module and NFKB1.


