
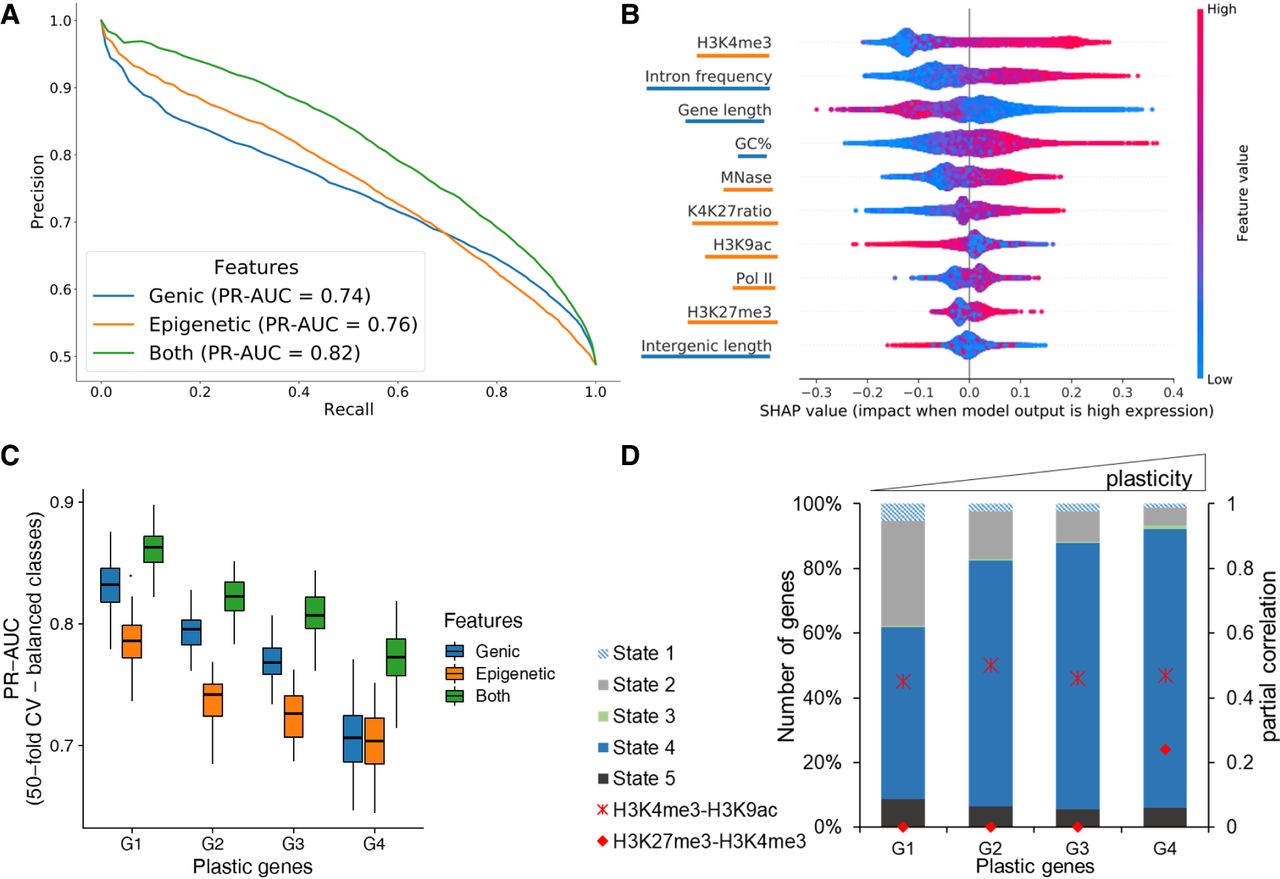
Prediction of gene expression by epigenetic marks and genomic features. (A) Results of classifying low and high gene groups using different data (genic: related to gene structure; epigenetic: using abundance of histone marks and MNase; both: genic and epigenetic). PrecisionRecall curve with average values from a 40-fold cross-validation with random forests indicating features by different colors. (B) Analysis of feature importance using both genic and epigenetic features (underlining color indicates type on y-axis; see legend for A). Features are listed in decreasing order of classification importance from top to bottom. The importance (SHAP value; x-axis) of a feature for each gene illustrates its contribution to classification as high or low, with positive and negative SHAP values, respectively. The color gradient depicts the feature value in scale from low to high, for example, the length of a gene (third row). For example, long genes strongly contribute to the prediction of lowly expressed genes. (C) Genes were separated into four groups by their plasticity, which is defined by a large variation in gene expression among different conditions. The box plot shows the distribution of classifier performance values for genes with different plasticity (50-fold CV-based PR-AUC) for the same three feature sets as A. The number of genes in each plastic gene group was randomly subsampled to have equal number of genes in high and low expressed category. (D) Distribution of CSs among plastic gene groups. We only included genes with a ChromHMM state overlap of at least 80% (see Fig. 5). Additionally, partial correlation values for H3K4me3-H3K9ac (cross) and H3K4me3-H3K27me3 (circle) are red for each group.


