
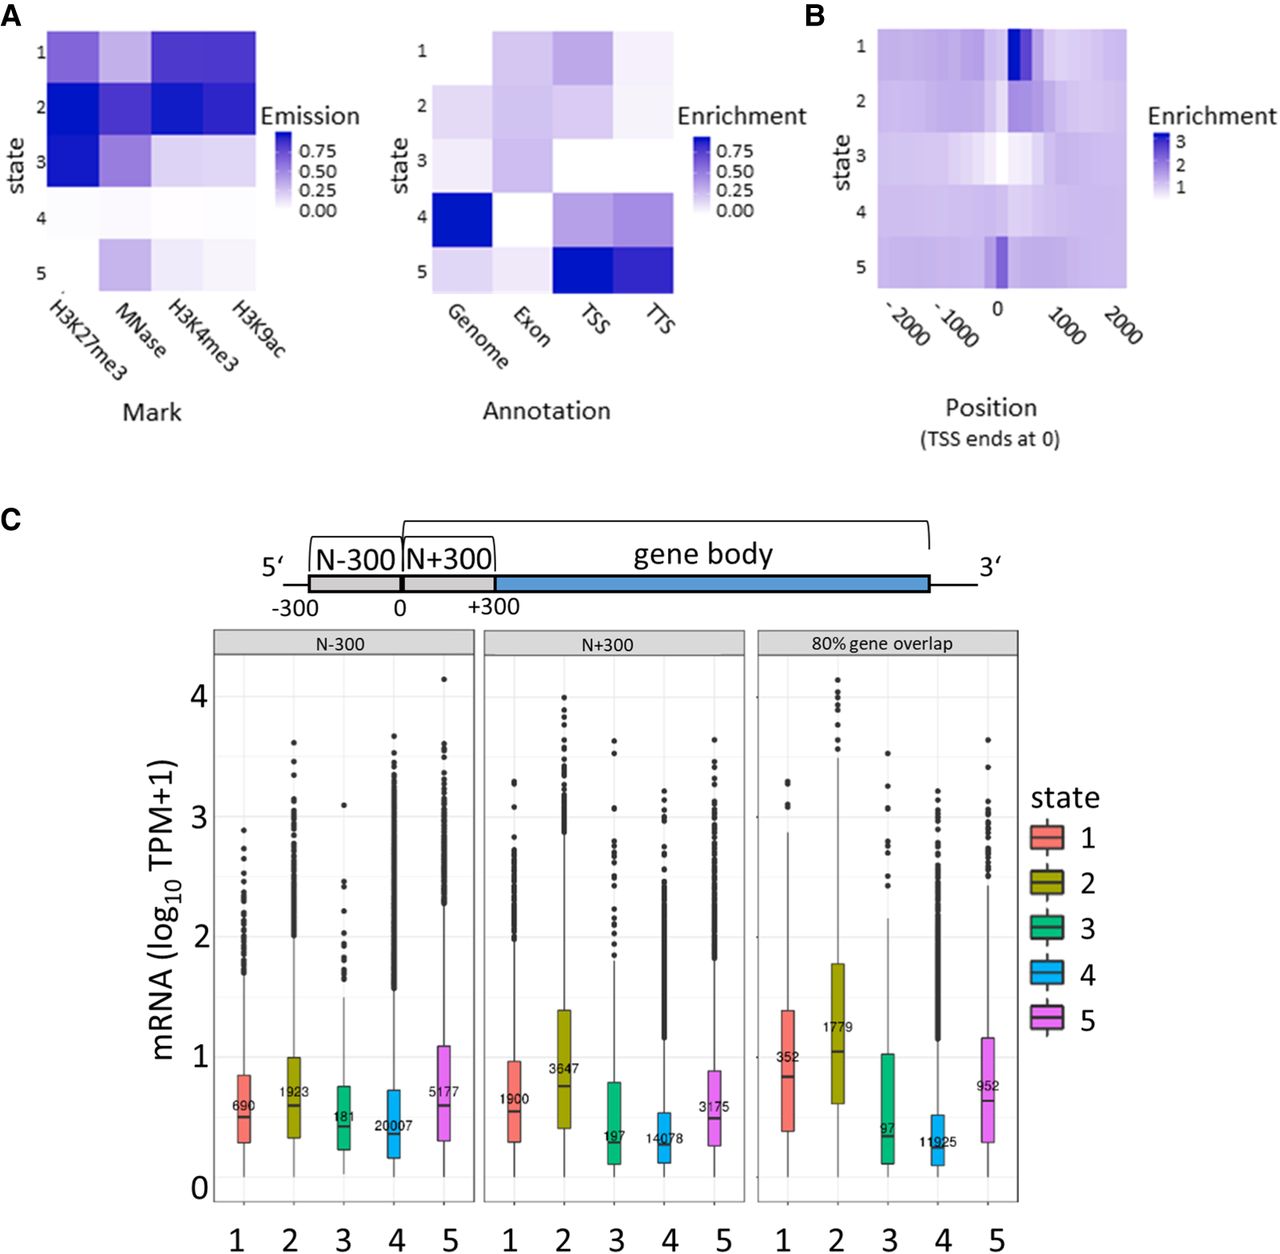
Segmentation analysis using ChromHMM. (A) The chromatin state (CS) assignments are shown as a heatmap of emission parameters from a five-state ChromHMM model (left). Each row corresponds to a ChromHMM state, and each column represents a different epigenetic mark. The darker the color of an epigenetic mark for a state, the higher the probability of observing that epigenetic mark in that state. Heatmap showing the overlap fold enrichment of each ChromHMM state (row) in different genomic annotations (columns; right). Enrichment values are obtained from the overlap enrichment functionality of ChromHMM with a column-specific color scale. (B) The fold enrichment of each state in 200-bp bins within a 2-kb window around the TSS is shown. Enrichment values are obtained from the neighborhood enrichment functionality of ChromHMM with a uniform color scale. (C) Box plots show mRNA expression (y-axis; 10 TPM + 1) of genes whose loci overlap at least 80% with a respective state (right). Additionally, genes were separated by their assigned state in 300 bp upstream of the TSS (N − 300) and the first 300 bp of the gene body (N + 300), and mRNA expression values of these genes are plotted (left, middle). Sketch on top of the plots visualizes the arrangement of the three analyzed regions.


