
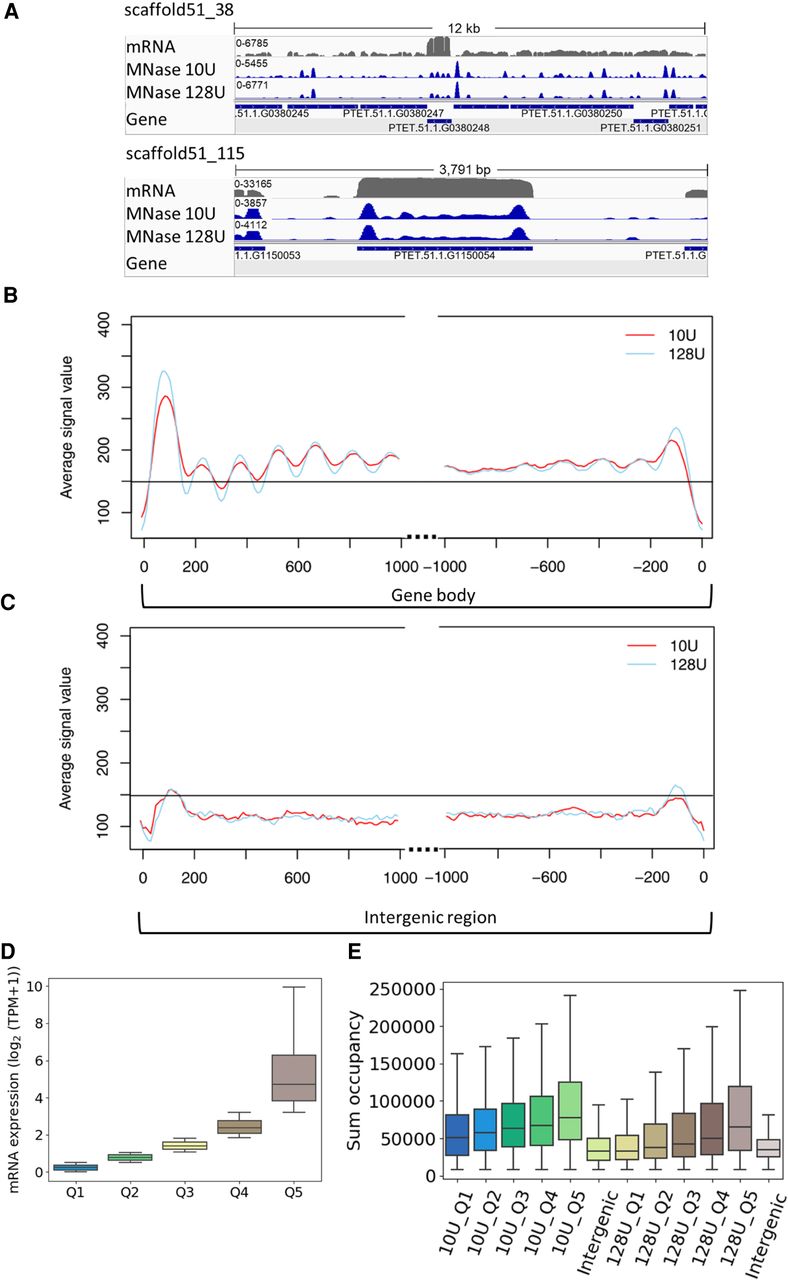
MNase-seq results reveal well-positioned +1 nucleosomes. (A) Exemplary view of nucleosome distribution along the MAC scaffolds of Paramecium. Top panel shows the peak distribution in a 12-kb window, and the bottom panel shows the magnified view on one gene. For both panels, the top row shows the coverage track from poly(A) mRNA-seq followed by the tracks for nucleosome occupancy obtained by light (10 U) and heavy (128 U) MNase digestion of Paramecium nuclei. Coverage tracks were visualized using the Integrative Genomics Viewer (IGV) browser (Robinson et al. 2011). (B) Profile plot of nucleosome distribution at the transcription start site (TSS; left) and transcription termination site (TTS; right) for genes >1 kb and digestion conditions as in A. The plot organization resembles the nucleosome profile along the gene body/intergenic region with dotted lines indicating excluded regions in the center of both plots. (C) Same plot as in B, but for intergenic regions >1 kb. Horizontal line is drawn to aid comparison between B and C. (D) Ranking of genes by their mRNA expression values from low to high (Q1–Q5) and (E) total sum occupancy for the genes in each expression quantile and the intergenic regions. Occupancy values are shown for mild and heavy digest side by side.


