
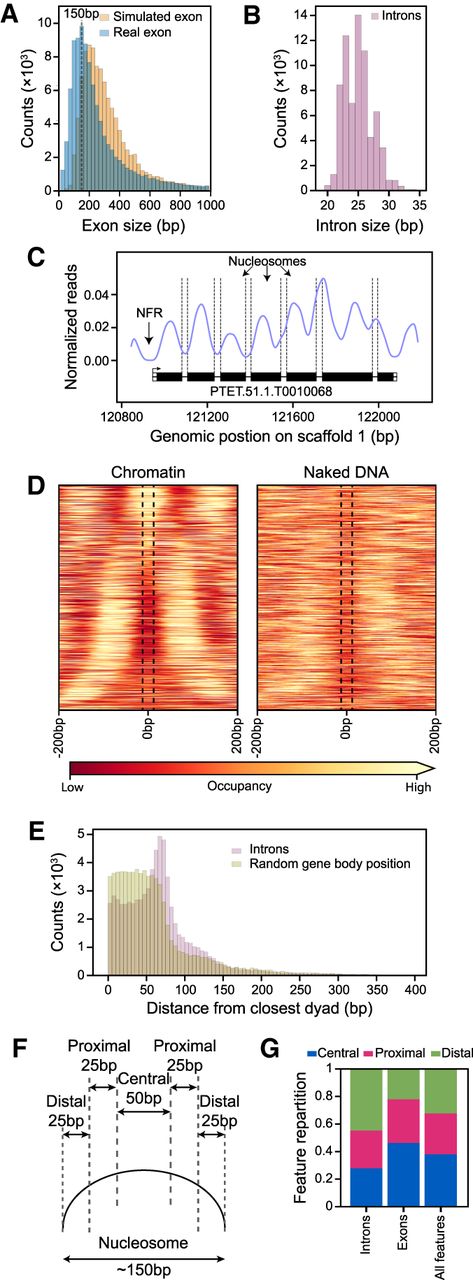
Inter-nucleosomal DNA is frequently associated with intron position. (A) Histogram showing exon size distribution (bin size = 25 bp): in blue are real exons; in orange, simulated exons created assuming uniform exon sizes within each gene. (B) Histogram showing intron size distribution (bin size = 1 bp). (C) Example track reporting nucleosome occupancy over genes with intron locations indicated by vertical dashed lines. We can observe nucleosome-free regions (NFRs) around the gene promoters and introns frequently associated with inter-nucleosomal DNA. (D) Heatmap showing nucleosome occupancy ±200 bp around intron centers. Introns are ordered based on increasing distances from their center to the closest nucleosome center, from top to bottom. The average of the chromatin samples is shown on the left and the average of the naked DNA samples on the right, with the same color-code as in Figure 1C. Vertical black dashed lines delineate the average size of an intron (25 bp). Individual samples are displayed in Supplemental Figure S2C. (E) Histogram reporting the distance of an intron center to the closest nucleosome center (red). For each intron, a random position inside the corresponding gene body was selected, and the distance to its closest nucleosome center is reported (green). Bin size = 5 bp. (F) Schematic representation of the criteria to assign features for each intron (or exon) into one of the three classes, based on the distance (d) between its center and the closest nucleosome center position: central, d ≤ 25 bp; proximal, 25 bp < d < 50 bp; and distal 50 bp ≤ d ≤ 75 bp. (G) Relative distribution of introns, exons, and both features over categories defined in panel F for the introns overlapping with a fixed nucleosome (∼70% of all introns; see Methods) and exons with a size <300 bp overlapping with fixed peaks. See Supplemental Figure S2D, including the features with d > 75 bp.


