
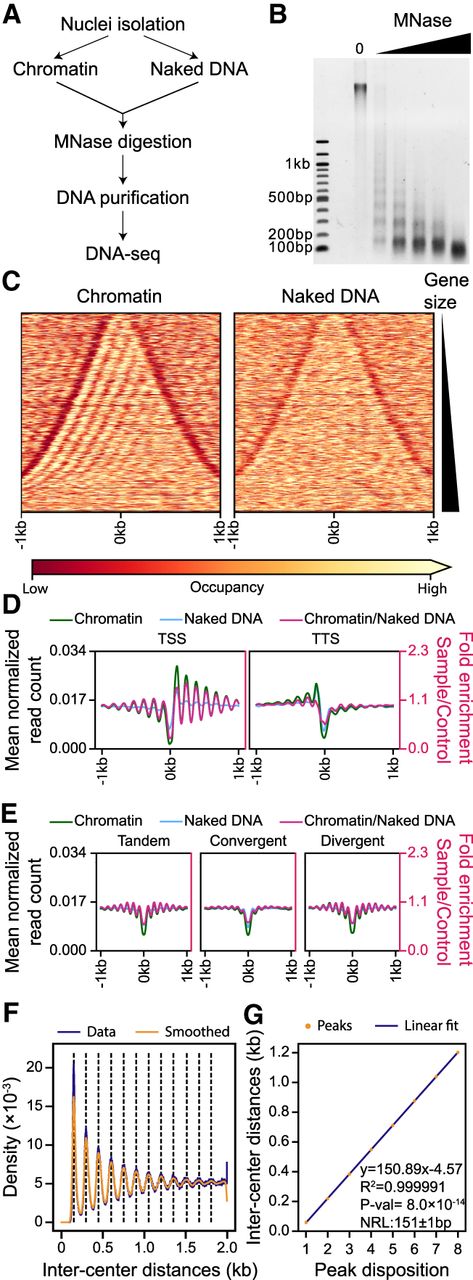
Nucleosome occupancy along the Paramecium MAC genome. (A) Schematic representation of the MNase-seq experiment. (B) MNase digestion of MAC chromatin with increasing MNase enzyme concentration. (C) Heatmap showing nucleosome occupancy ±1 kb around the center of each gene ordered by gene size (small genes on top and large genes at the bottom) for 38,143 genes located on scaffolds that are at least 200 kb long. (Left) Average of two chromatin-treated samples (Chromatin); (right) average of two naked DNA control samples (Naked DNA). (D) Average nucleosome occupancy around transcription start sites (TSSs) identified by 5′ CAP-seq on the left and transcription termination sites (TTSs) identified by poly(A) detection on the right: in green is the average profile of the chromatin-treated sample (Chromatin); in blue, the average profile of the naked DNA sample (Naked DNA); and in magenta, the Chromatin/Naked DNA ratio, enrichment of which is shown on the second axis on the right (red axis). (E) Average nucleosome occupancy ±1 kb around the center of intergenic regions: same color-code as in panel D. Intragenic regions have been divided into three groups based on the relative positions of gene pairs: tandem (left), convergent (middle), or divergent (right). (F) Inter-center distance between well-positioned nucleosomes (Methods) on the same scaffold. In blue are distance distributions from actual data (from 1 bp to 2 kb, binning = 1); in orange, the Gaussian smoothed signal. Black dashed lines indicate the local maxima (peak centers) of the smoothed data (Methods). (G) In orange are the first eight local maxima from panel F ordered by increasing distance; in blue, the linear fitted model. At the bottom right, information about linear fitting and estimated NRL (Mean ± SD) is given. P-value is calculated using a two-sided Z-test.


