
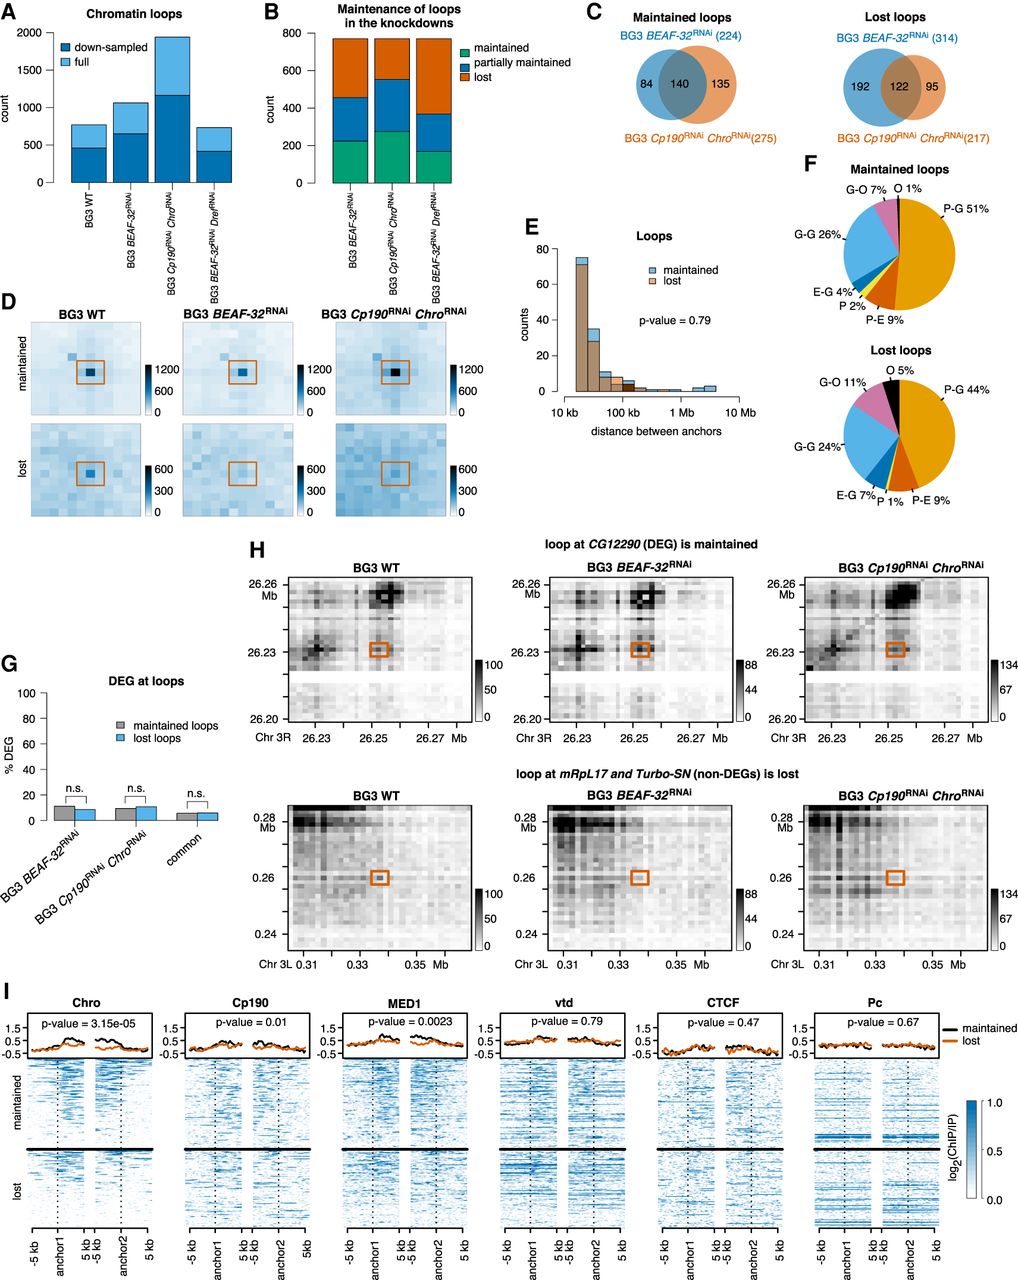
Chromatin loops. (A) Number of loops detected in WT and the three knockdowns. Dark blue represents the loops that are detected in both full and down-sampled (where we randomly removed 20% of the reads) data sets, and light blue represents loops detected only in the full data set. (B) Number of loops in the three knockdowns that maintain both of the anchors (maintained), only one of them (partially maintained), or lose both anchors (lost). (C) Overlap of loops maintained or lost between WT and BEAF-32 knockdown and between WT and Cp190 Chro double knockdown. We classify the commonly maintained borders in the two knockdowns as maintained and the commonly lost borders as lost. (D) Aggregate peak analysis (APA) using Juicer (Durand et al. 2016) over the maintained (top) and lost (bottom) chromatin loops at 2-kb resolution. (E) Size of the maintained and lost chromatin loops. We performed a Mann–Whitney U test, which confirmed that the two distributions are not different. (F) Annotation of maintained and lost loops with respect to the features they connect: (P) promoters (up to 1 kb upstream of TSS), (E) enhancers, (G) genes, and (O) others. We used STARR-seq for enhancer annotation (Yanez-Cuna et al. 2014). (G) Percentage of genes that are differentially expressed and are associated with maintained and lost chromatin loops. We selected genes that have their promoter (up to 1 kb upstream of TSS) located at one of the anchors of the chromatin loops. There is no statistically significant difference between DEG at maintained and lost loops (Fisher's exact test; P-value 0.37, 1.0, and 1.0). (H) Contact matrices plots of a maintained (top) and a lost (bottom) loop. These maps were constructed with diffHic (Lun and Smyth 2015) at 2-kb resolution (the same used to detect loops) and contain 30 bins. Dark color represents more contact. We scaled the pallet in the two knockdowns to account for library size differences. (I) Enrichment of architectural proteins and transcription-related factors at maintained and lost loops (Chro, Cp190, MED1, vtd, CTCF, and Pc). We performed a Mann–Whitney U test of the mean signal at maintained and lost loops (see corresponding P-values).


