
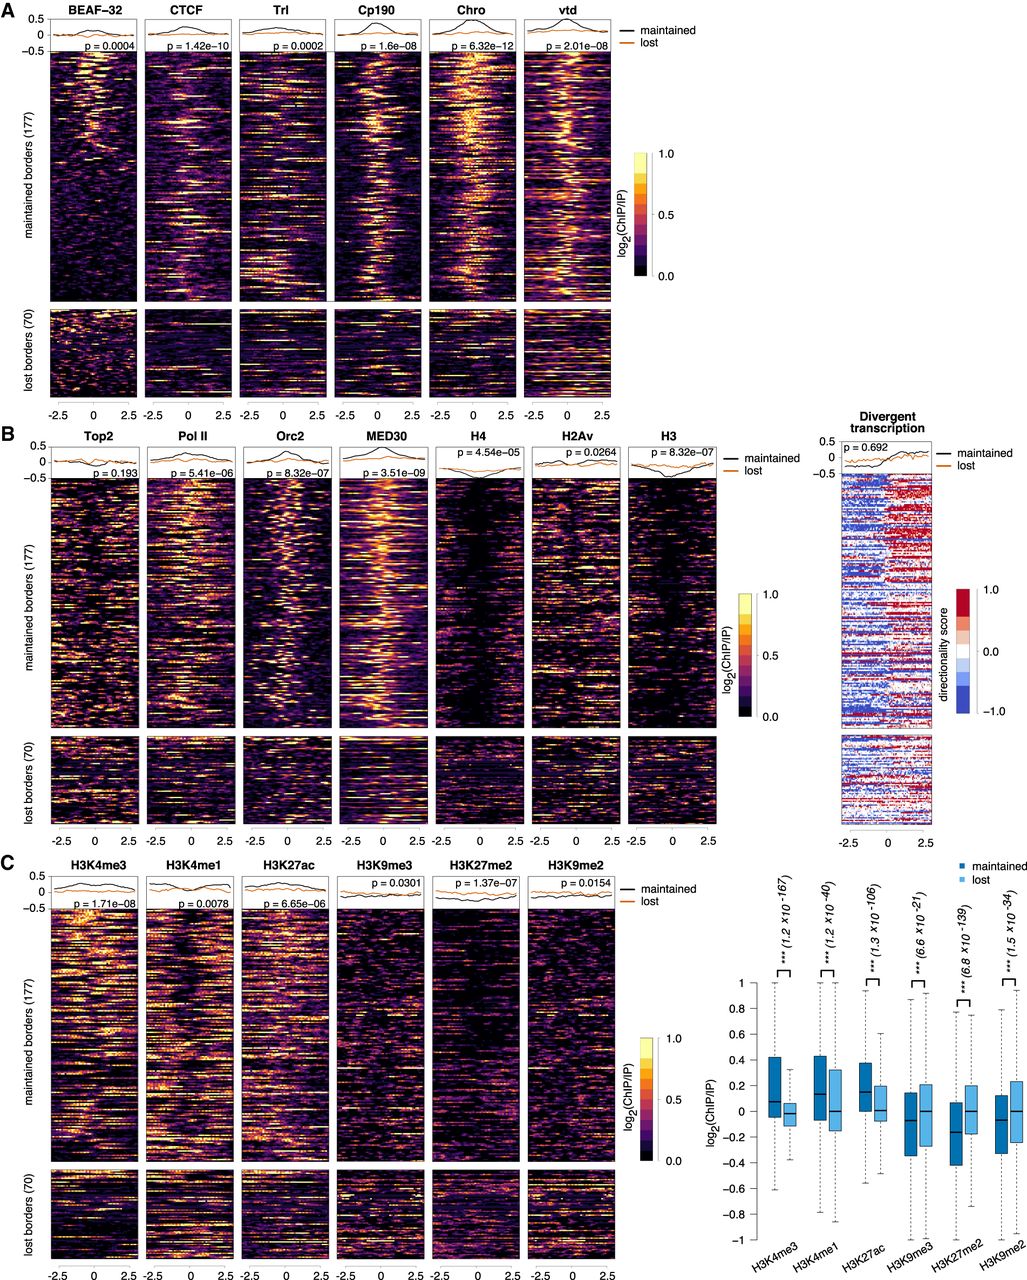
Chromatin feature enrichments at TAD borders. (A) Profiles of architectural proteins (BEAF-32, CTCF, Trl, Cp190, Chro, and vtd) around direct maintained and lost TAD borders that were common in BEAF-32 knockdown and Cp190 Chro double knockdown. Top lines represent the corresponding average profiles at maintained and lost borders. We also performed the Mann–Whitney U test between the average signal at each maintained border and each lost border (corresponding P-value added to the plot). (B) Profiles of histones (H4, H3, and H2Av), transcription (Pol II, 3′NT-seq, MED30, and Top2), and replication (Orc2) at maintained and lost TAD borders. For nascent transcription, we used two color schemes: orange for transcription on the negative strand and blue for transcription on the positive strand. (C) Profiles of histone modifications (H3K4me3, H3K4me1, H3K27ac, H3K9me3, H3K27me2, and H3K9me2) at maintained and lost TAD borders. There is depletion of signal in the middle of the histone modifications heat maps, which can be explained by the depletion of histones in those regions (see B).


