
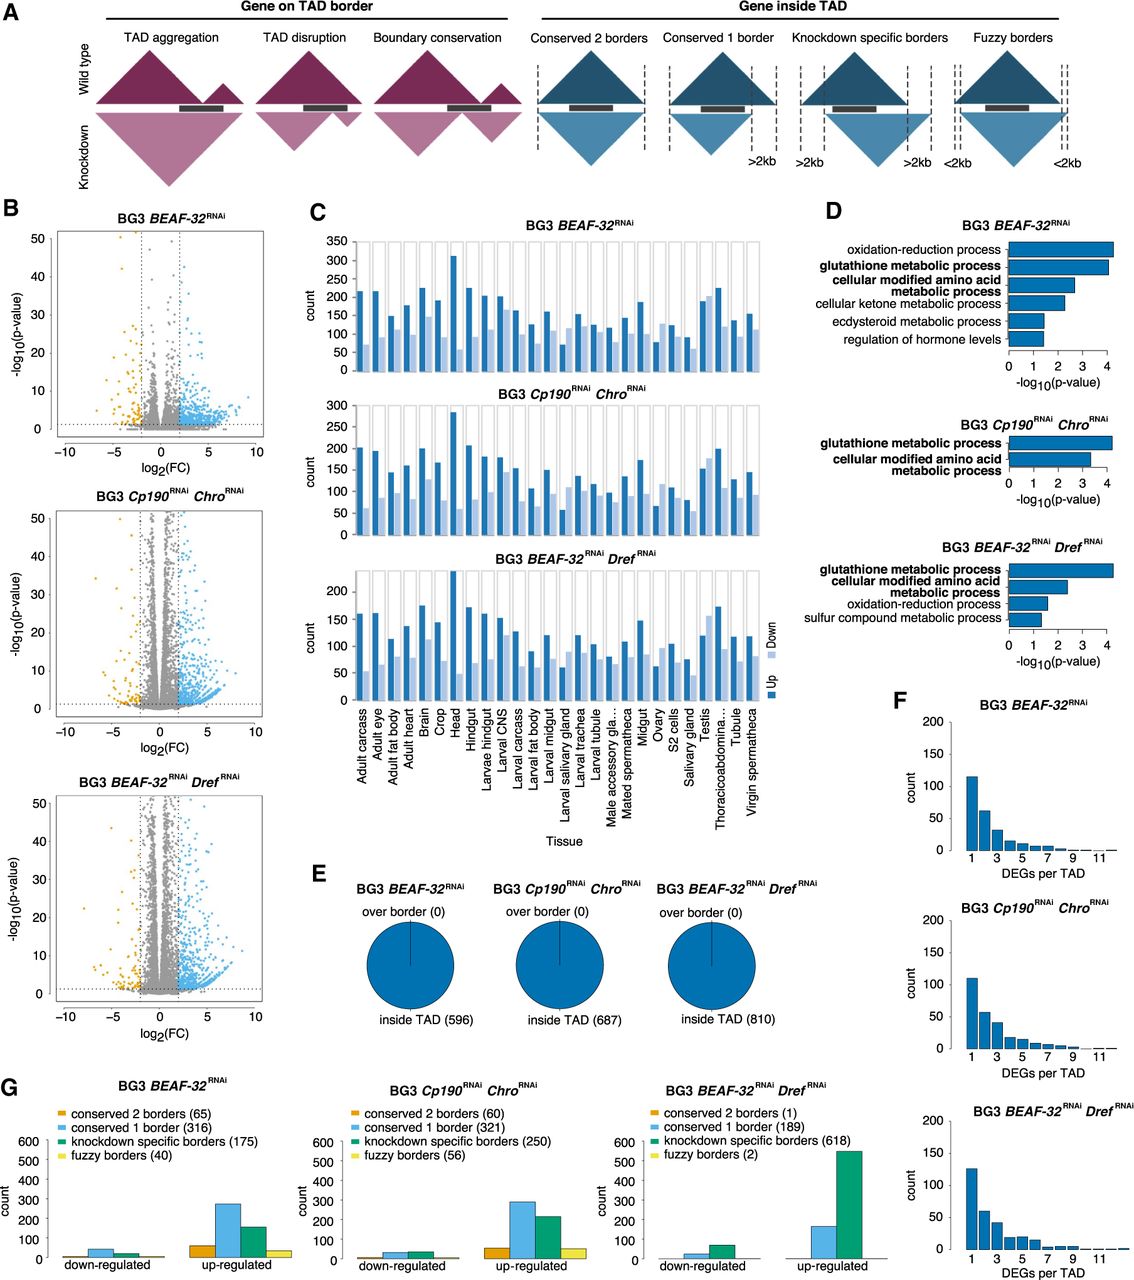
The effects of TAD reorganization on transcription. (A) The different cases for position of genes in TADs and how the TADs change in the knockdown (red for cases where the gene spans over TAD borders and blue for the cases where the gene is within the TADs). (B–G) We consider the case of the three knockdowns separately: BEAF-32 knockdown, Cp190 Chro double knockdown, and BEAF-32 Dref double knockdown. (B) Volcano plots for the RNA-seq analysis (orange represents down-regulated genes, blue up-regulated, and gray non-DEG) in the three knockdowns. (C) FlyAtlas expression data (Chintapalli et al. 2007) for all DEGs in each knockdown. For this analysis, we used FlyMine web server (Lyne et al. 2007). (D) GO enrichment analysis of all DEGs in each knockdown using the FlyMine web server (Lyne et al. 2007). Bold terms are the ones common in all three knockdowns. (E) The number of differentially expressed genes, where over boarder represents red scenario from A and inside TAD represents blue scenario from A. (F) Histogram with the number of DEGs in TADs (large number of TADs have more than one DEG). (G) The number of down-regulated and up-regulated genes in different cases where the gene is within the TADs (orange: both TAD borders are conserved, blue: only one of the TAD border is conserved, green: none of the TAD border is conserved, and yellow: TAD borders are shifted within 2 kb).


