
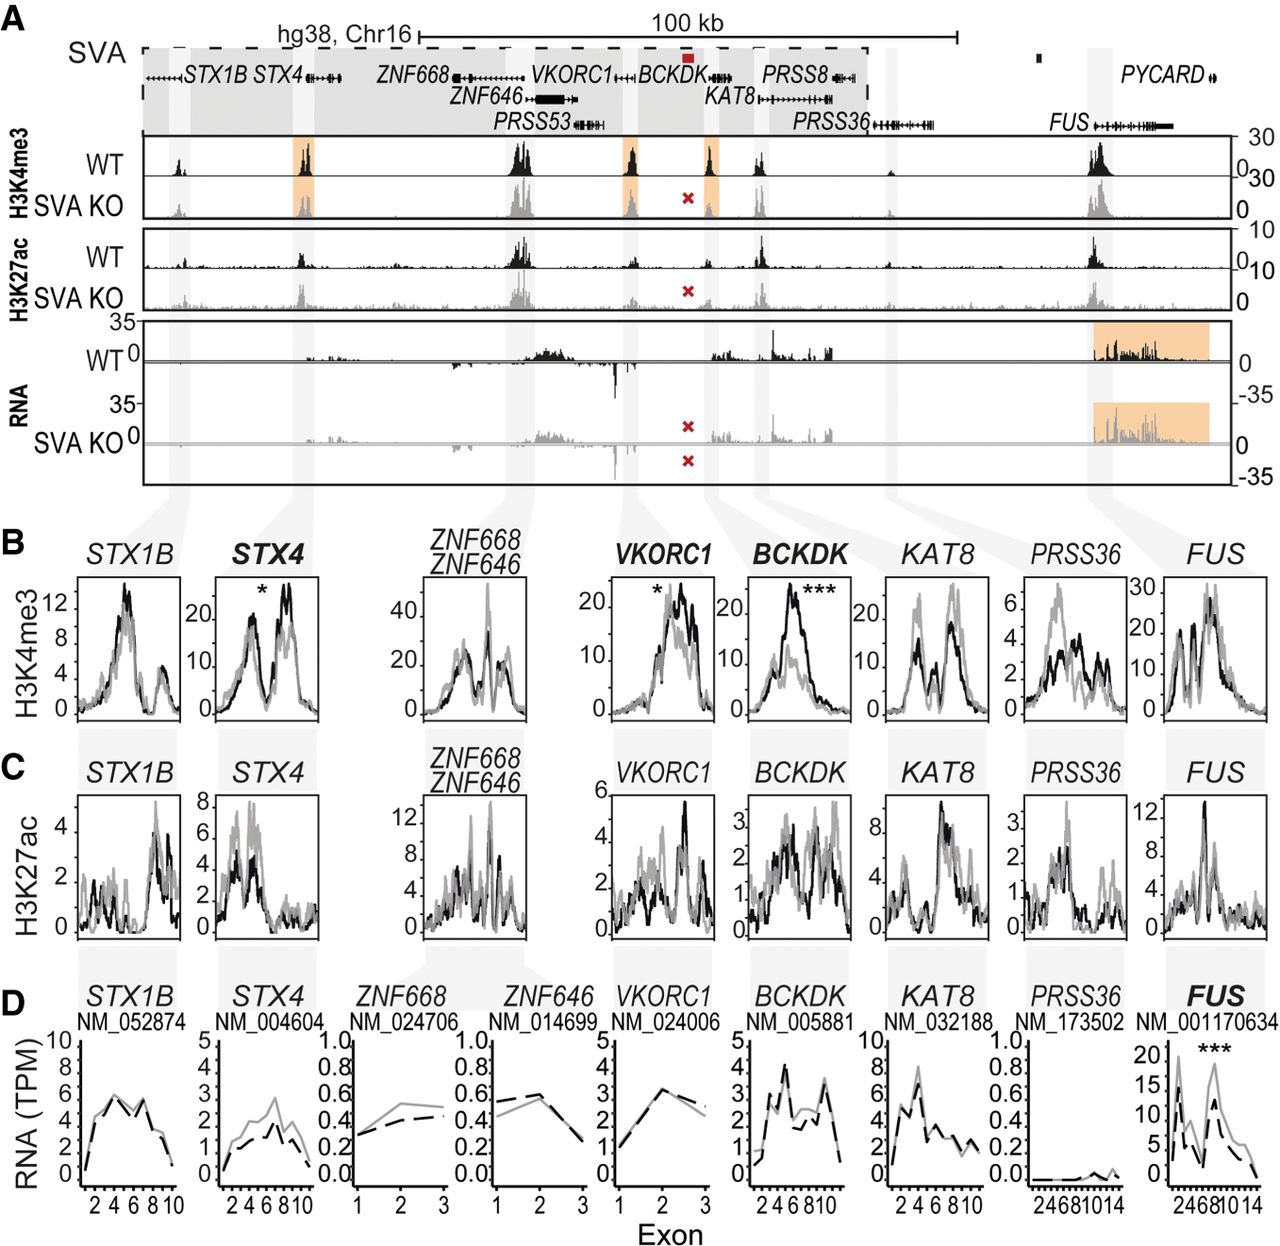
Figure 6.
SVA deletion alters the epigenome and nearby gene expression. (A) Overview of locus. LD block shown in gray box, location of SVA removed by CRISPR-Cas9 KO shown in red. (B–D) Magnification of genes within a 200 kb region of deleted SVA. (B) H3K4me3 ChIP-seq, the mean of three replicates is shown. (C) H3K27ac ChIP-seq, the mean of three replicates is shown. (D) Mean expression of three replicates shown per exon for transcripts. Adjusted P-value of DESeq2 is shown for the whole transcript and ChIP peaks. (***) P < 0.001, (*) P < 0.05. Genes reaching statistical significance are indicated in bold.


