
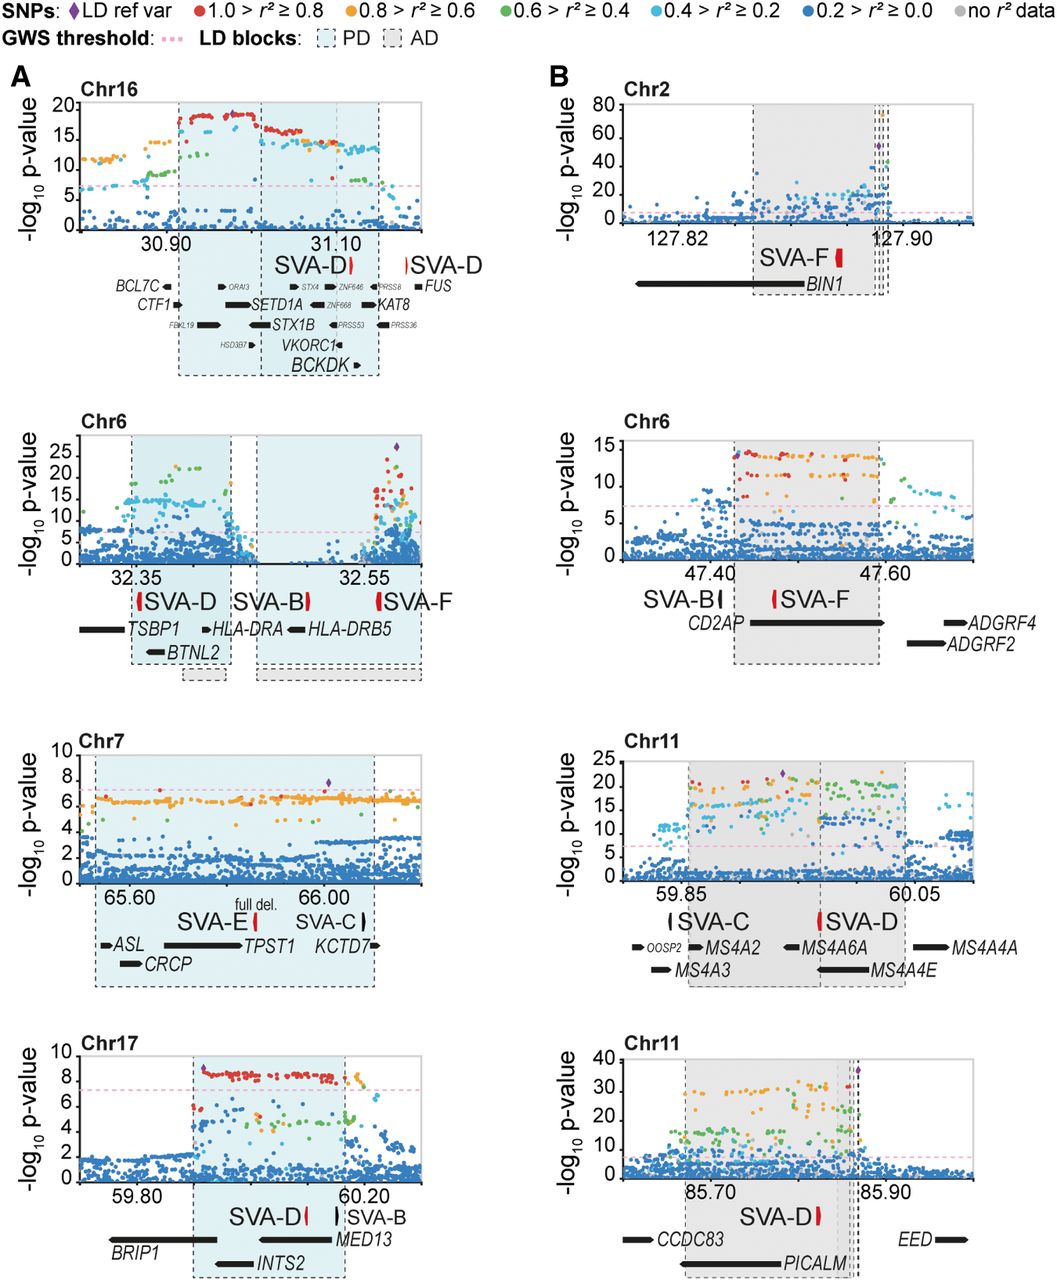
Figure 3.
SV-SVAs reside in Parkinson's and Alzheimer's disease–associated LD blocks. (A,B) Regional SNP association plots with SV-SVAs (red) shown in LD blocks of PD (blue) (A) and AD (gray) (B). The associated SNPs (AD; de Rojas et al. 2021, PD; Nalls et al. 2019) are plotted with their respective meta-analysis genome-wide significant P-values (GWS [Genome-wide significance], P < 5 × 10⁻⁸; as −log10 values) and are distinguished by linkage disequilibrium (r2) of nearby SNPs on a blue to red scale, from r2 = 0 to 1, based on pairwise r2 values from the 1000 Genomes Phase3 (ALL) reference panel. Gene annotations: NCBI RefSeq Select database. Assembly GRCh37, scale in Mb.


