
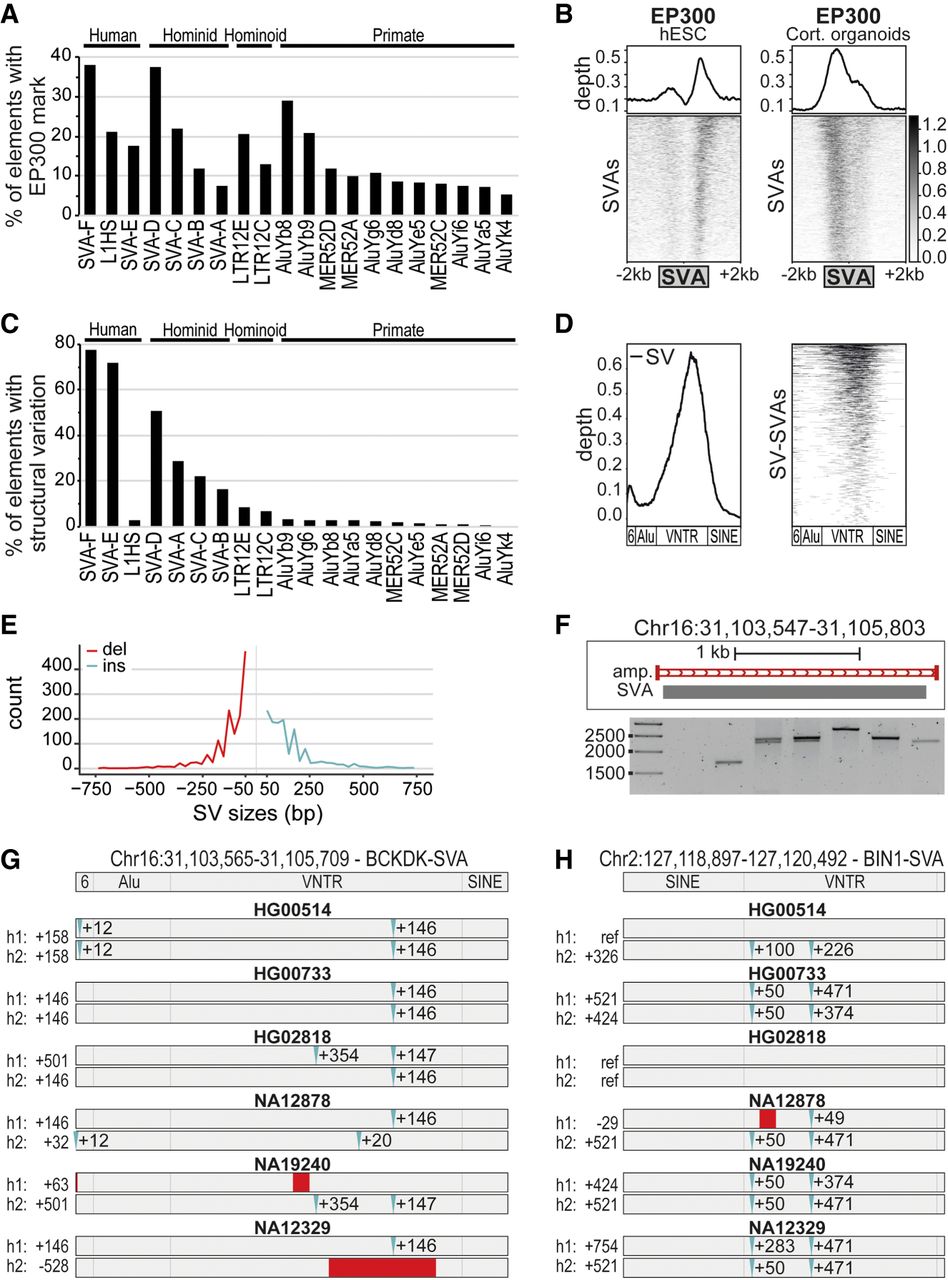
SVAs are a major contributor to inter-individual structural variation. (A) Percentage of transposable elements with EP300 enhancer mark in cortical organoids; the top 20 enriched elements are shown. (B) Coverage heatmaps at full-length SVAs (GRCh37) in hESCs and cortical organoids for EP300 (hESCs: average of two replicates; cortical organoids: average of two biological and two technical replicates). Bottom gray box: average size SVAs. (C) Percentage of “full-length” TEs per class with structural variation based on Audano et al. (2019), grouped by the species they originated in. (D) Relative abundance of structural variation (left) and corresponding coverage heatmap (right) showing that most structural variation resides in the VNTR region of SVAs. Approximate SVA structure is shown below. (E) Distribution of structural variation (SV) sizes for insertions (ins) and deletions (del) in SVAs. (F) Example of structural variants for SVA in PCR-amplified region Chr 16: 31,103,547–31,105,803 (GRCh38 assembly). PCR-amplified region shown in red. (G,H) Schematic overview of SV-SVAs in phased assemblies of Ebert et al. (2021) of listed genomes for specified regions with approximate size shown. Estimated location of insertions (blue) and deletions (red) compared to reference genome.


