
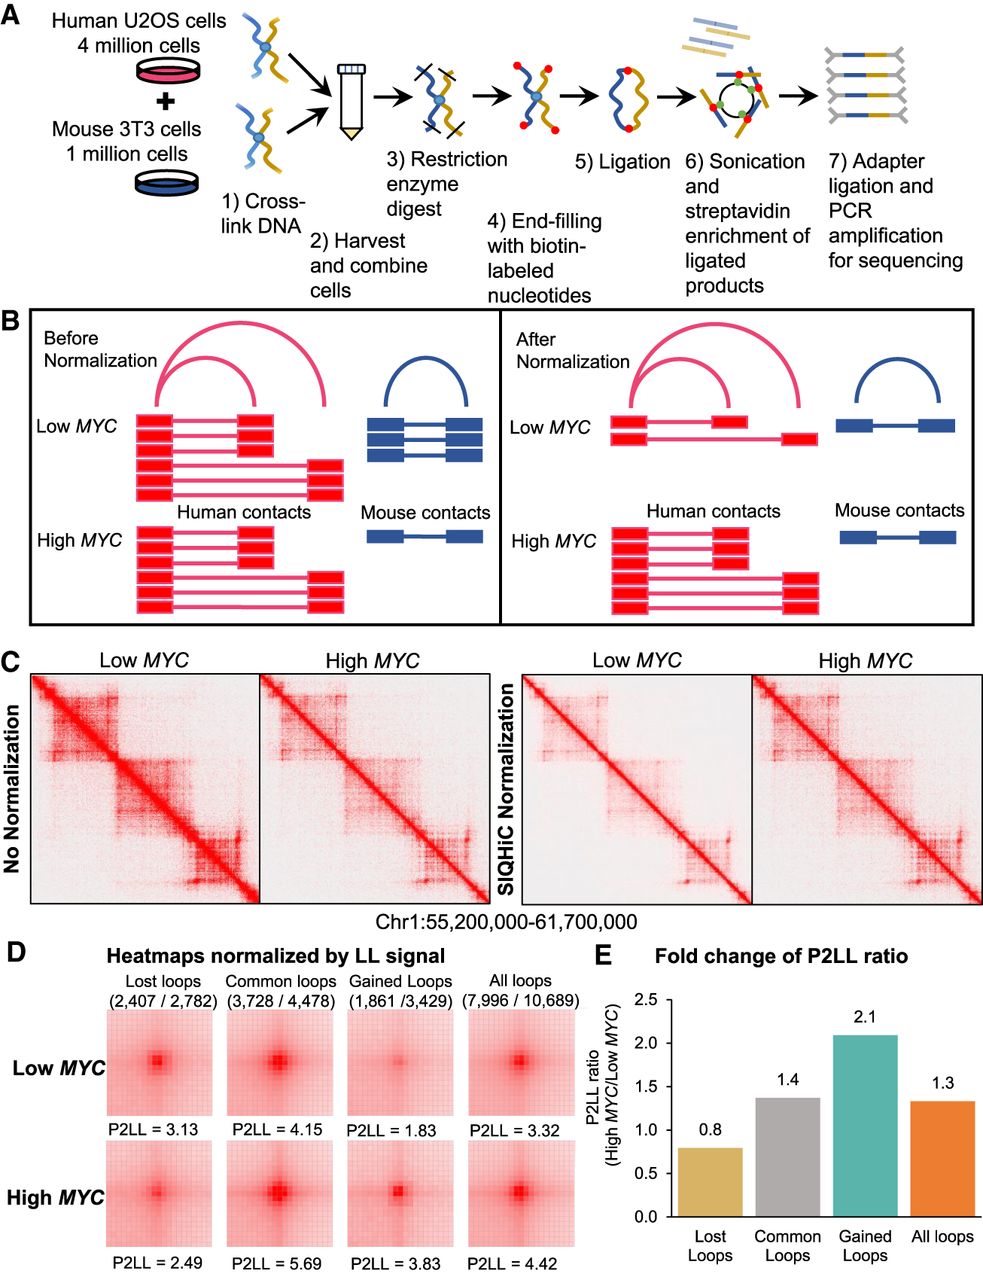
SIQHiC normalization reveals increased chromatin contact frequency per cell after MYC overexpression. (A) Brief overview of the SIQHiC workflow. (B) Cartoon illustrating Hi-C contacts before (left) and after (right) SIQHiC normalization. SIQHiC normalization scaled down the Low MYC contacts such that the number of mouse contacts in both conditions was the same, thereby revealing an increase in human chromatin contacts. (C) Hi-C matrix heat maps of a region on Chromosome 1. Left panel: No normalization. Right panel: SIQHiC normalization. (D) Aggregate Peak Analysis (APA) plots at 5-kb resolution showing the aggregate signal of “Lost,” “Common,” and “Gained” chromatin loop sets in Low MYC and High MYC cells identified using the nonnormalized Hi-C contact matrices. (P) Peak signal at the center pixel, (LL) average signal of the 3 × 3 square at the lower left corner of the APA plot, representing local background, (P2LL) ratio of P to LL. APA color scales were normalized by the LL signal. Loop sets were filtered to remove short loops near the diagonal (shown above each APA plot; numerator: number of filtered loops; denominator: total number of loops). (E) Fold change of P2LL ratio between High MYC and Low MYC cells.


