
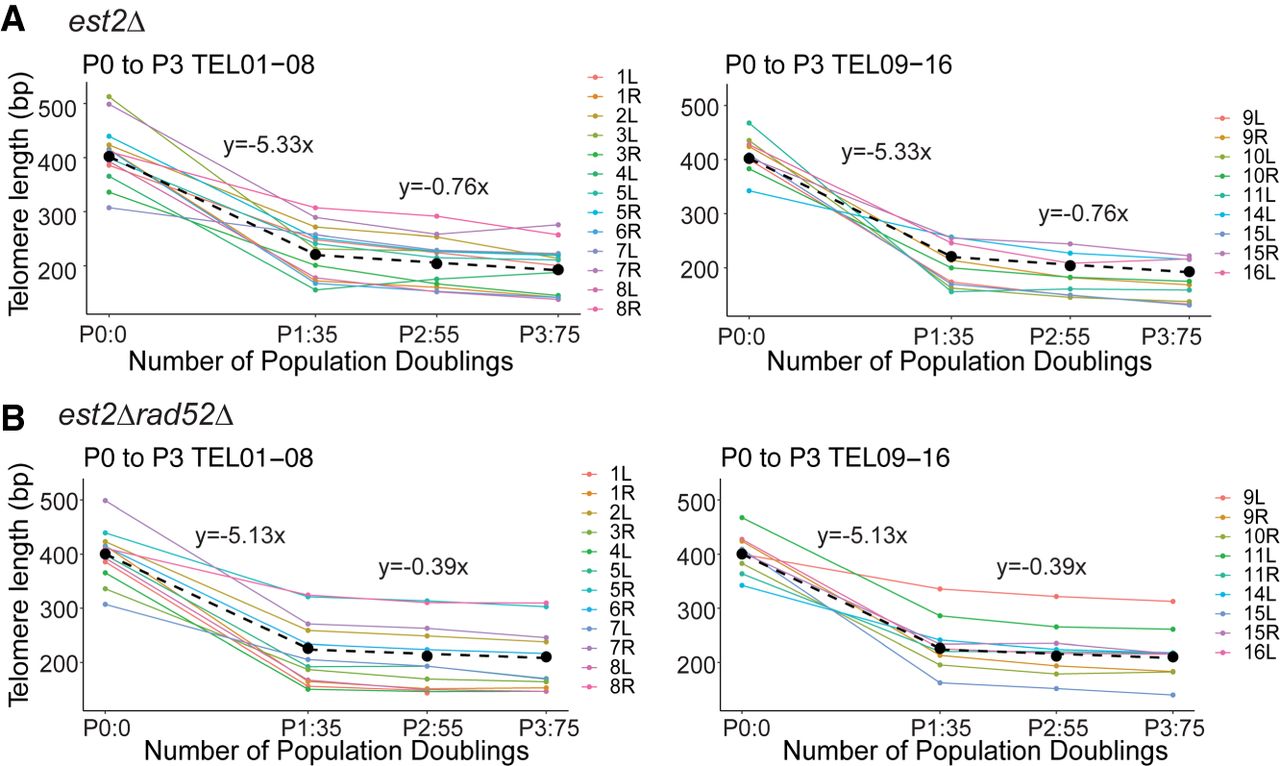
Telomere shortening rate in the absence of telomerase. (A) The progression of mean telomere length at individual chromosome ends in est2Δ cells over three passages. TEL01-08 and TEL09-16 are shown on separate graphs for clarity. The initial telomere length, P0, is estimated from the wild-type parental strain for each chromosome, and so it is not the exact genotype (see Results). The line of best fit to the average of the shortening rate is shown as a black dotted line. The rate of shortening for P0 to P1 and P1 to P3 are plotted separately because the two rates differ and each rate is reported above the line. (B) The rate of telomere shortening for the est2Δ rad52Δ strain was measured as described above in A.


