
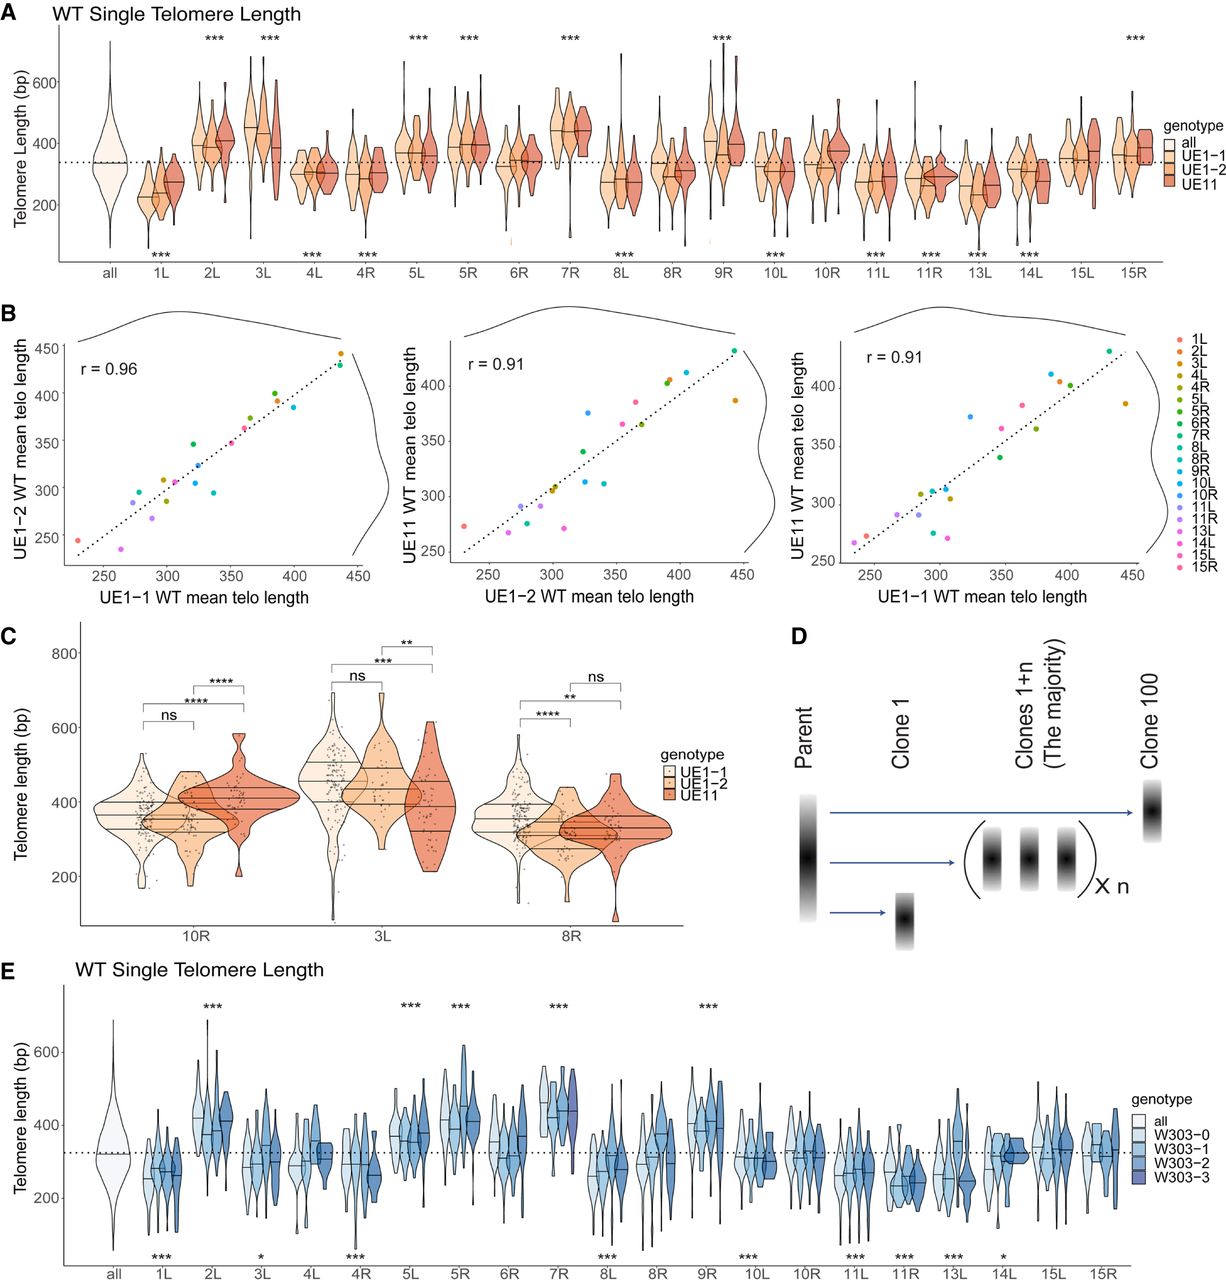
Nanopore sequencing mapping of the telomere length distribution of each individual chromosome end. (A) Bulk telomere length (all) and telomere length for each chromosome end were mapped by aligning to internal unique sequences. Three independent clones were sequenced: two from UE1 (UE1-1 and UE1-2) and one from UE11 (see Supplemental Fig. S6). Telomere lengths are reported as violin plots with a line at the mean. A dotted line shows the mean of the total population at 343.3 for WT cells. Analysis of the mean (ANOM) multiple contrast test of each telomere against the grand mean of all telomere length profiles was performed (see Supplemental Fig. S8A), and P-values adjusted by the Bonferroni method are reported as (*) <0.05, (**) <0.01, (***) <0.001, (****) <0.0001, or (n.s.) not significant. To note, TEL01L is engineered (as described in the text) in the UE1 strains, and TEL11R is engineered in the UE11 strains. (B) Pairwise correlations of mean telomere length across each of the three replicates for WT. A linear model was fit to the data (dotted line) to calculate the correlation constant, reported as the r-value. Marginal density of each data set is plotted as solid black lines across the top and right of the plots to show the spread of telomere lengths across each population. (C) Clonal variation was observed at TEL10R, TEL03L, and TEL08R in WT cells. Individual telomere length reads are represented as single points within the violin plots. The significance of the difference between two samples was tested using a multiple t-test (Methods) and P-values adjusted by the Bonferroni method are reported as above. (D) Model of clonal variation in which the telomere length of the majority of clones remains at the parental average, but occasional length outliers may seed new distributions represented by Clone 1 and Clone 100. (E) Three independent clones from the W303-0 parent were passages for 120 population doublings in independent cultures. The resulting clones W303-1, W303-2, and W303-3 were sequenced along with the parent W303-0 (see Supplemental Fig. S9A). Telomeres for each chromosome end were mapped by aligning to internal unique sequence. ANOM multiple contrast test of each telomere against the grand mean of all telomere length profiles was performed (see Supplemental Fig. S8B) and P-values adjusted by the Bonferroni method are reported as (*) <0.05, (**) <0.01, (***) <0.001, (****) <0.0001, or (n.s.) not significant.


